Business Status Analysis Graph & Table – Visualization of Market Analysis
RM0200011_13
- Last Update 02/04/2025
- File Size 1MB
- # of Slides 2
- File Format PPTX
- Slide Ratio 16:9
- Color
Keywords
- #Content-Based Slides
- #Design-Based Slides
- #Market and Competitor Analysis
- #Diagram
- #Graph
- #Market Status
- #Market Analysis
- #Table
- #Other
- #Radar Chart Spider Chart
- #16:9
- #radial diagram PowerPoint
- #5-axis chart slide
- #market analysis presentation
- #business evaluation graph
- #how to create radial diagram in PowerPoint
About the Product
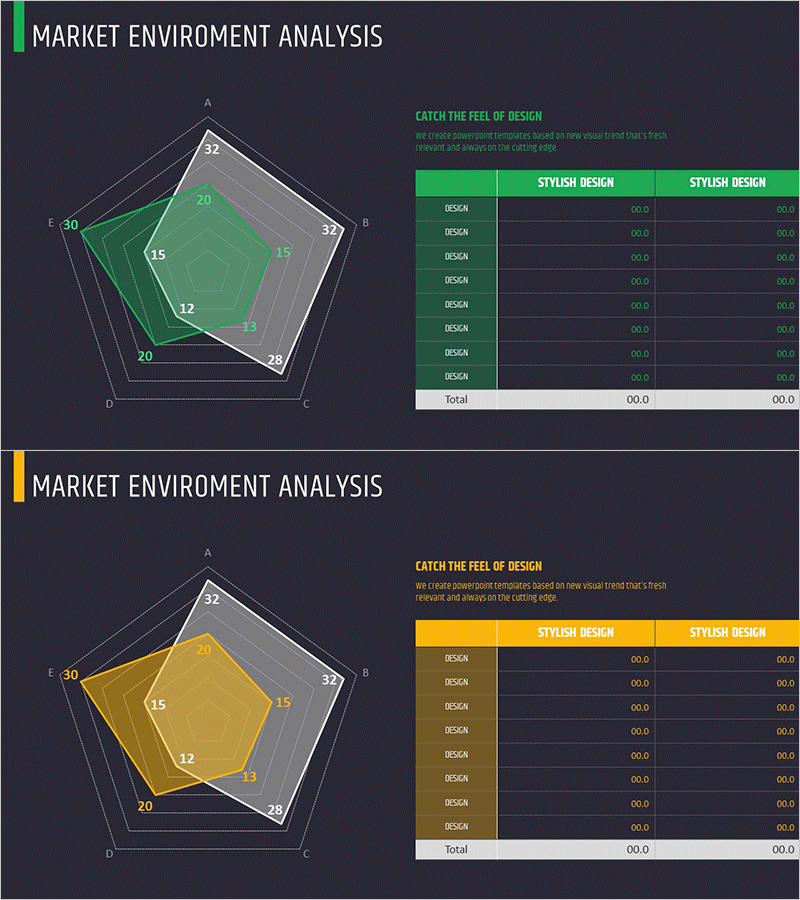
A radial diagram PowerPoint slide with five axes for comprehensive market analysis visualization. Perfect for displaying competitive positioning, business performance metrics, and environmental factors across multiple dimensions. Features two color versions—green and yellow—allowing you to emphasize different analytical perspectives. Input numerical values into each axis and the diagram automatically adjusts to reflect your data. Includes a companion data table slide for detailed metrics, making it ready for presentations, business reports, and strategic planning documents.
Usage Points
-
Main Usage
Visualize five key performance indicators or evaluation criteria simultaneously using a radial layout. Enables quick comparison of strengths and weaknesses across multiple dimensions such as market position, competitive advantage, technology, marketing capability, and financial performance.
-
How to Use
Enter numerical values on each axis and the diagram automatically reshapes to reflect your data. Use the green version for positive assessments and yellow for areas requiring attention. Complete your presentation by adding detailed metrics and explanations in the accompanying data table.
-
Recommended For
Strategic planning presentations, market analysis reports, competitive benchmarking analysis, investor relations materials, executive briefings, management consulting proposals, and business performance reviews. Ideal for strategy, marketing, and business development professionals presenting to senior management.
-
Slide Structure
Two-slide set: radial diagram with five axes (green and yellow versions) plus data input table. Diagram accepts numerical values from 0 to 32 on each axis. Table contains eight metric rows and two data columns for comprehensive analysis documentation.
Related Products
-

Radar Charts and Tables – Market Analysis and Comparison
#Product/Service Introduction #Market and Competitor Analysis #Diagram
-

Usage Analysis Graph – Visualizing Market Status
#Market and Competitor Analysis #Diagram #Graph
-

Table Template for Data Summary – Efficient Planning
#Market and Competitor Analysis #Diagram #Market Status
-

Green Analysis Chart for Market Overview – Effective Data Comparison
#Market and Competitor Analysis #Diagram #Graph
