Business Profit Analysis Results – Visualization of Market and Customer Feedback
RM0200008_18
- Last Update 02/03/2025
- File Size 1MB
- # of Slides 2
- File Format PPTX
- Slide Ratio 16:9
- Color
Keywords
- #Content-Based Slides
- #Design-Based Slides
- #Market and Competitor Analysis
- #Customer Success Stories
- #Diagram
- #Graph
- #Market Analysis
- #Customer Testimonials and Feedback
- #Table
- #16:9
- #market analysis PowerPoint slide
- #profit analysis presentation template
- #business chart slide
- #financial data visualization
- #how to create market analysis in PowerPoint
About the Product
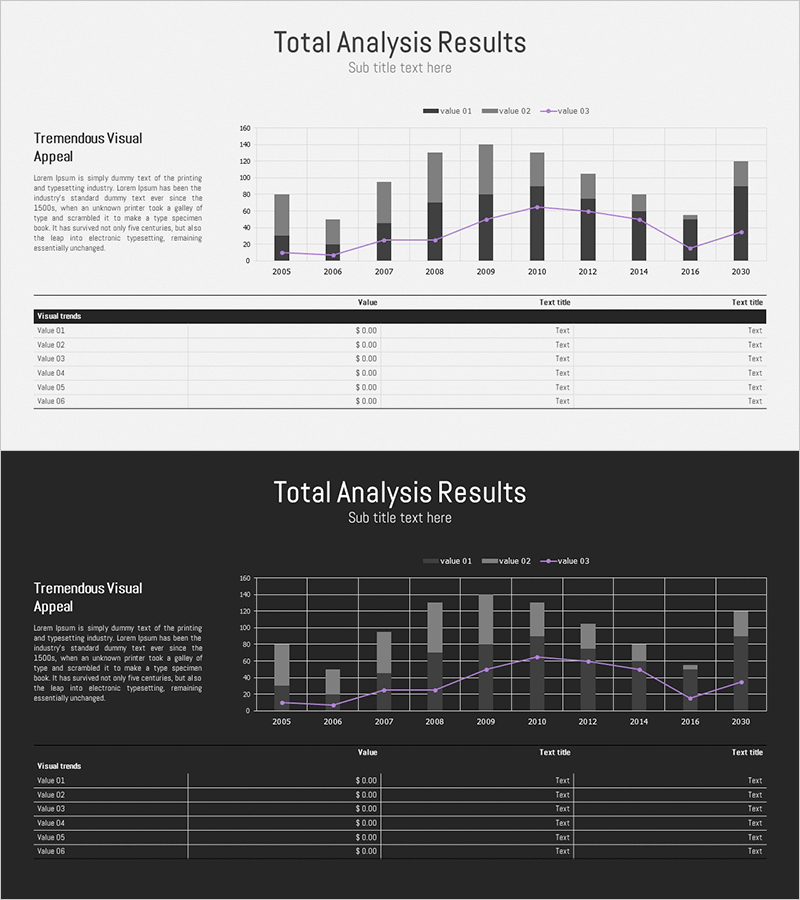
A professional PowerPoint slide set for visualizing business profit analysis and market evaluation data. Features a light gray background with black and dark gray bar charts combined with purple trend lines, effectively representing multi-layer data across years 2005–2030. The 2-slide set includes a standard layout and a dark-background variant for flexible presentation environments. Each slide contains a descriptive text area and a 6-value data table below the chart, reinforcing quantitative credibility. Includes both light and dark theme options to adapt to different venue lighting conditions. Ready-to-use for investor presentations, financial reports, and market analysis sections in business decks.
Usage Points
-
Main Usage
Simultaneously present market trends and customer evaluation metrics to quantitatively demonstrate business performance. Bar charts emphasize absolute values while trend lines highlight growth patterns, providing data-driven decision support.
-
How to Use
Deploy in investor pitches, executive reports, and market analysis sections to showcase historical performance alongside future projections. Light background optimizes for standard meeting rooms; dark background suits dimly-lit presentation venues.
-
Recommended For
Finance teams, marketing departments, executives, and investor relations professionals presenting quarterly or annual performance. Ideal for startup fundraising decks, corporate earnings presentations, and consulting proposals requiring credibility enhancement.
-
Slide Structure
2-slide configuration. Each slide contains title area, descriptive text box (left), combined bar-line chart (right), and 6-metric data table (bottom). 16:9 widescreen aspect ratio ensures compatibility with modern presentation systems.
Related Products
-

Customer Evaluation and Feedback Analysis Graph – Insights Centered on Customers
#Market and Competitor Analysis #Customer Success Stories #Diagram
-

Shareholder Status Analysis Chart & Description – Sleek Diagram
#Company Introduction #Market and Competitor Analysis #Diagram
-

Shareholder Status Analysis Data Chart – Insights and Market Analysis
#Company Introduction #Market and Competitor Analysis #Diagram
-

Visualizing Board Members and Shareholders with a Sleek Diagram
#Company Introduction #Market and Competitor Analysis #Diagram
