Customer Evaluation and Feedback Analysis Graph – Insights Centered on Customers
RM0200003_17
- Last Update 02/01/2025
- File Size 2.8MB
- # of Slides 2
- File Format PPTX
- Slide Ratio 16:9
- Color
Keywords
- #Content-Based Slides
- #Design-Based Slides
- #Market and Competitor Analysis
- #Customer Success Stories
- #Diagram
- #Graph
- #Market Analysis
- #Customer Testimonials and Feedback
- #Table
- #Column
- #Grouped Column
- #16:9
- #grouped bar chart PowerPoint
- #customer evaluation analysis slide
- #5-item comparison chart
- #data visualization presentation
- #how to create grouped bar chart in PowerPoint
About the Product
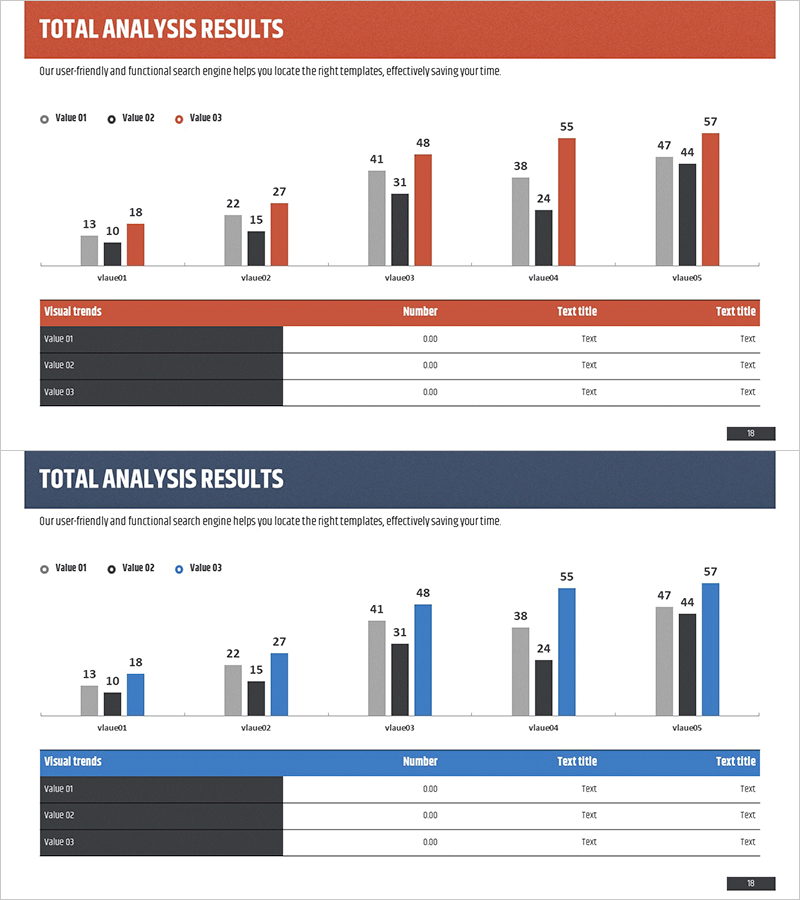
A grouped bar chart PowerPoint slide for visually analyzing customer evaluations and feedback across multiple dimensions. The slide features three data series (gray, black, and orange bars) comparing five evaluation items (Value 01 through Value 05) side by side, enabling clear numerical comparison. This design is ideal for multi-dimensional analysis such as customer satisfaction scores, service quality ratings, and product performance metrics. The template includes 2 slides in 16:9 widescreen format and is fully editable in PPTX format for immediate customization.
Usage Points
-
Main Usage
Present customer satisfaction surveys, service quality assessments, and product performance evaluations by comparing five items across three different perspectives simultaneously. Ideal for executive reports, marketing analysis presentations, and customer success case studies that require comprehensive data-driven insights.
-
How to Use
Adjust the bar heights to input your actual data values and update the legend labels (Value 01, 02, 03) to match your evaluation categories. Customize the color scheme to align with your corporate branding, and add relevant titles and descriptive text to contextualize the data for your audience.
-
Recommended For
Marketing teams analyzing customer feedback, sales teams conducting competitive analysis, executive reporting, consulting firms presenting market research findings, product development teams evaluating user satisfaction, and business analysts comparing multi-dimensional performance metrics.
-
Slide Structure
Two-slide template with grouped bar chart design. The first slide displays a 5-item grouped bar chart with three data series in gray, black, and orange, accompanied by a data table with Visual trends, Number, and Text title columns. The second slide provides the same chart structure with navy, black, and blue color variations for design flexibility.
Related Products
-

Performance Analysis Table Slide – Market and Competitor Analysis
#Market and Competitor Analysis #Diagram #Graph
-

Key Management Indicators and Performance Analysis Chart - Business Strategy
#Business Strategy #Market and Competitor Analysis #Diagram
-

Competitor Comparison Analysis Graph - A Tool for Effective Market Analysis
#Market and Competitor Analysis #Diagram #Graph
-

Touch Wide Slide Template – Column Chart & Table
#Market and Competitor Analysis #Diagram #Graph
