Market Analysis Using Pencil Bar Graph
RJ0500009_12
- Last Update 06/09/2025
- File Size 0.3MB
- # of Slides 2
- File Format PPTX
- Slide Ratio 16:9
- Color
Keywords
About the Product
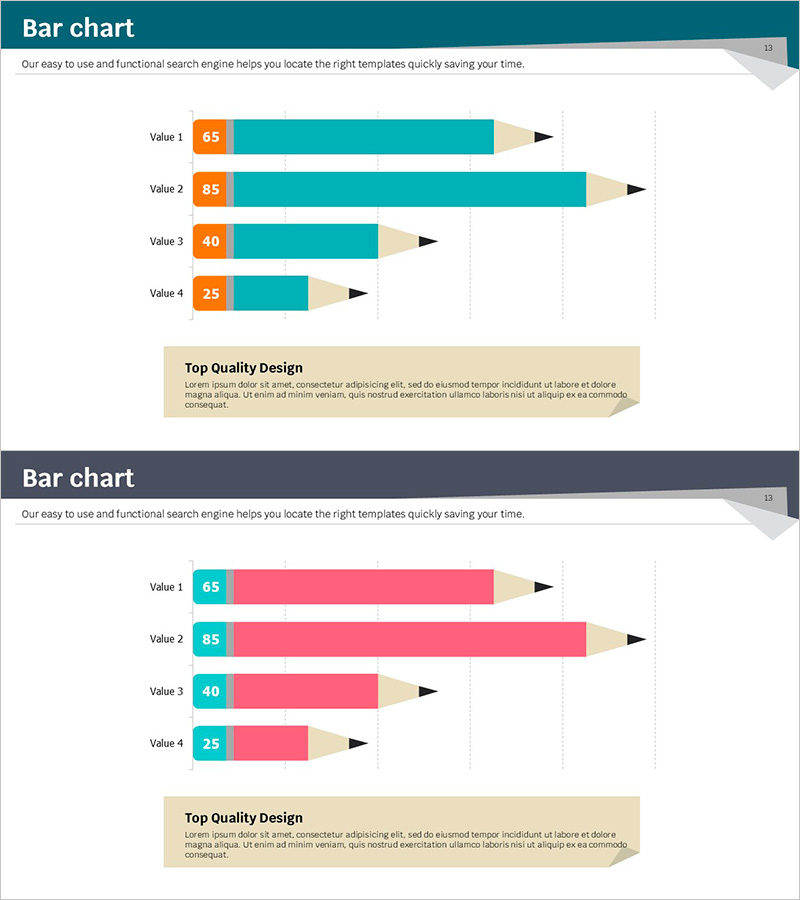
A horizontal bar chart PowerPoint slide optimized for market analysis and competitive positioning comparisons. This presentation template features a pencil-shaped design with orange value boxes and teal bars, creating an intuitive data visualization for comparing four data points. The 16:9 widescreen format includes 2 slides with text description areas, ready for immediate editing and customization. Perfect for business presentations including market analysis, competitor benchmarking, performance metrics, and strategic planning decks.
Usage Points
-
Main Usage
Visualize market data, competitor metrics, and performance indicators using horizontal bar charts with a creative pencil design. This slide transforms numerical data into clear, comparative visuals that support decision-making and strategic discussions in business presentations.
-
How to Use
Input actual values and labels into Value 1-4 fields, then edit the title and description text areas to match your presentation context. The teal bar lengths and orange value boxes adjust automatically, and color customization is straightforward for brand alignment.
-
Recommended For
Ideal for market analysis reports, competitive intelligence presentations, business performance reviews, investor pitch decks (IR), and marketing strategy documents. Recommended for planning teams, marketing departments, and executive-level reporting where quantitative data emphasis is critical.
-
Slide Structure
Two-slide set with consistent layout: title area + four-item horizontal bar chart + bottom description text box. First slide features teal background; second uses dark gray background to provide visual variety and document flow within presentations.
Related Products
-

World Travel Template Area Chart
#Market and Competitor Analysis #Graph #Other
-

Graph Trend by Instrument Session – Competitive Analysis Visualization
#Market and Competitor Analysis #Graph #Other
-

Digital Device Usage Overview Slide – Market Analysis and Competitive Advantage
#Market and Competitor Analysis #Graph #Other
-

Area Chart for Science Topics – Gain Competitive Advantage through Data Analysis
#Market and Competitor Analysis #Graph #Other
