Analysis of Climbing Types Slide
RJ0600090_29
- Last Update 07/15/2025
- File Size 1.7MB
- # of Slides 2
- File Format PPTX
- Slide Ratio 16:9
- Color
Keywords
- #Content-Based Slides
- #Design-Based Slides
- #Company Introduction
- #Market and Competitor Analysis
- #Diagram
- #Graph
- #Key Achievements
- #Competitive Advantage
- #Table
- #Circles
- #Pie Chart
- #16:9
- #pie chart PowerPoint slide
- #3-segment pie chart template
- #climbing types analysis slide
- #market segmentation PPT
- #comparison chart download
About the Product
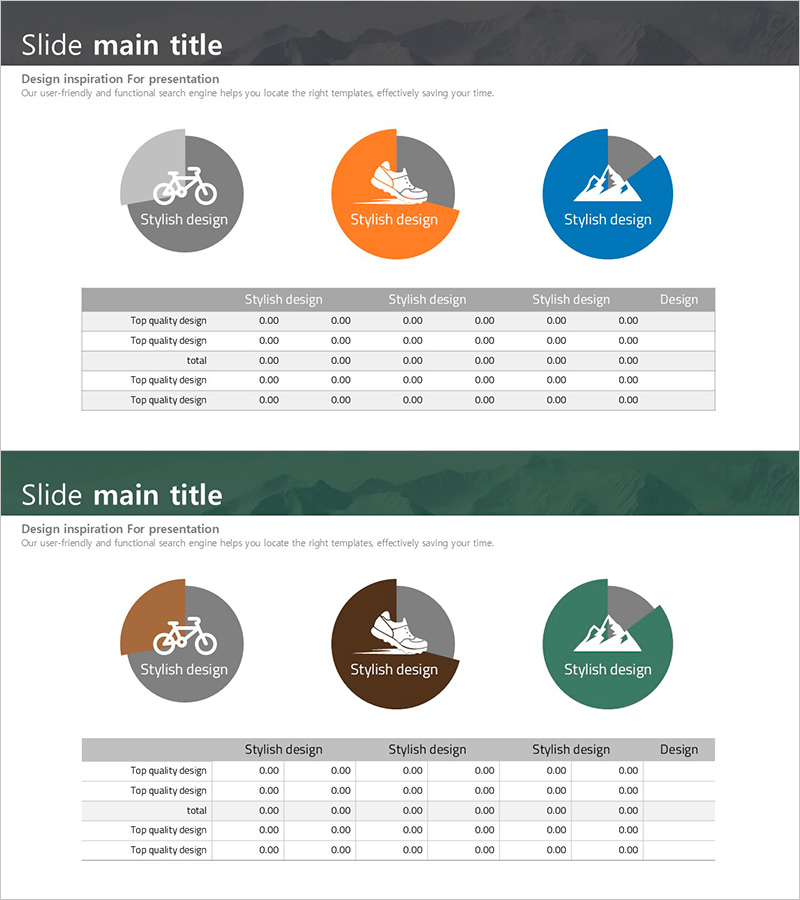
A PowerPoint pie chart slide comparing climbing types across three distinct segments with visual icons and data table. The design features a circular chart divided into three sections using gray, orange, and blue color coding, each labeled with category icons representing different climbing activities. The two-slide set includes the pie chart visualization on the first slide and a detailed data table on the second, displaying numerical values and comparative metrics. Ideal for market analysis presentations, competitive analysis reports, and category segmentation in business proposals.
Usage Points
-
Main Usage
Visualize and compare climbing type categories by proportion using a three-segment pie chart. The circular chart structure clearly shows relative market share or distribution across segments, while the accompanying data table provides specific numerical values for detailed analysis.
-
How to Use
Insert into business plans, market analysis reports, or competitive analysis presentations in the category comparison or market segmentation section. Replace sample data with actual figures in both the pie chart and data table for immediate presentation use.
-
Recommended For
Marketing professionals, business analysts, consultants, and strategy planners presenting market segmentation, customer classification, or product category analysis. Applicable to climbing and outdoor recreation industries as well as general business analysis and competitive positioning.
-
Slide Structure
Two-slide layout. Slide 1: Three-color pie chart (gray, orange, blue) with category icons (bicycle, shoe, mountain silhouette). Slide 2: Data table with 6 columns × 5 rows for numerical comparison. 16:9 widescreen format, PPTX file type.
Related Products
-

Key Performance Analysis Table – Achievements at a Glance
#Company Introduction #Market and Competitor Analysis #Diagram
-

Red-Blue Stereoscopic Pie Charts – Performance Visualization
#Company Introduction #Market and Competitor Analysis #Diagram
-

Key Performance Table – Visualizing Business Achievements
#Company Introduction #Market and Competitor Analysis #Diagram
-

Business Note Analysis Circle Graph & Table – Market and Competitive Analysis
#Market and Competitor Analysis #Diagram #Graph
