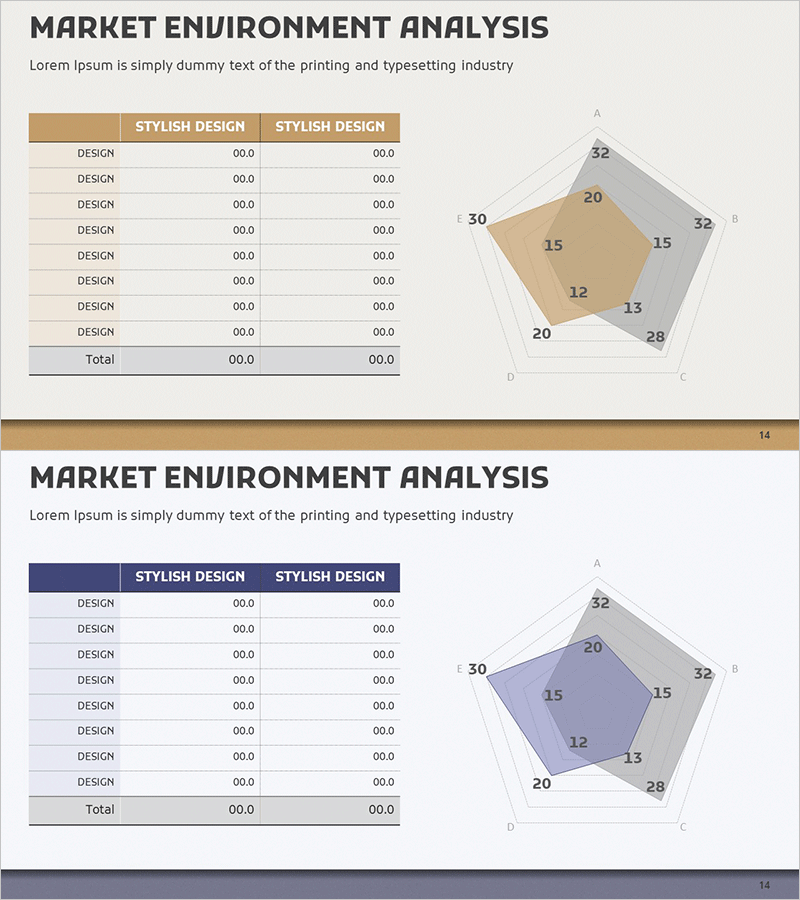
Insights into Market Analysis – Radial Graph
RM0200007_13
- Last Update 02/02/2025
- File Size 1.9MB
- # of Slides 2
- File Format PPTX
- Slide Ratio 16:9
- Color
Keywords
About the Product
A 5-axis radial graph PowerPoint slide designed for market environment analysis and competitive positioning. Available in two color schemes—beige and blue—this presentation template enables you to input numerical data on each axis to visualize market positioning, competitor comparison, and capability assessment. The hierarchical structure with a central core value and five outer evaluation points (A–E) allows complex multi-dimensional data to be understood at a glance. Ready-to-use for business analysis, strategic planning, and report presentations.
Usage Points
-
Main Usage
Optimized for comparing and visualizing five or more evaluation dimensions simultaneously—such as market environment analysis, competitive positioning, and organizational capability assessment. The numerical difference between the central value and outer axes intuitively highlights strengths and weaknesses.
-
How to Use
Enter evaluation criteria names on each axis (A–E) and input numerical values ranging from 0 to 52 from center to outer edge. Select either the beige or blue color scheme to match your corporate brand or presentation context. Apply to reports, strategy presentations, and investor briefing slides.
-
Recommended For
Executives, strategy teams, marketing professionals, consultants, and analysts presenting market analysis, competitive strategy, and organizational assessment results to leadership, clients, and investors. Ideal for business plans, marketing proposals, management reports, and consulting presentations.
-
Slide Structure
Two radial graph variants (beige and blue) with 5 axes (A–E). Each axis includes a 0–52 numerical input range, a central core value (12–15), and five outer evaluation points (20–32) arranged in a hierarchical data visualization structure.
Related Products
-

Customer Behavior Analysis by Country – Strategic Business Proposal
#Business Strategy #Market and Competitor Analysis #Diagram
-

Market Outlook Segmentation Analysis Graph – Strengthening Business Strategy
#Company Introduction #Market and Competitor Analysis #Diagram
-

Academic Specific Gauge Closure Diagram – Streamlining Marketing Strategies
#Marketing Plan and Strategy #Diagram #Graph
-

Sales and Profit Analysis Tables & Graphs – Data-Driven Insights
#Market and Competitor Analysis #Financial Plans and Performance #Diagram
