Renewable Energy Icons and Hexagonal Pie Charts
RJ0600067_4
- Last Update 07/07/2025
- File Size 0.3MB
- # of Slides 2
- File Format PPTX
- Slide Ratio 16:9
- Color
Keywords
- #Content-Based Slides
- #Design-Based Slides
- #Business Introduction
- #Diagram
- #Graph
- #Business Areas
- #Technological Status
- #Spread
- #Circles
- #Pie Chart
- #16:9
- #hexagonal pie chart PowerPoint
- #renewable energy presentation slide
- #4-segment data visualization
- #pie chart diagram template
- #energy data PowerPoint slide
About the Product
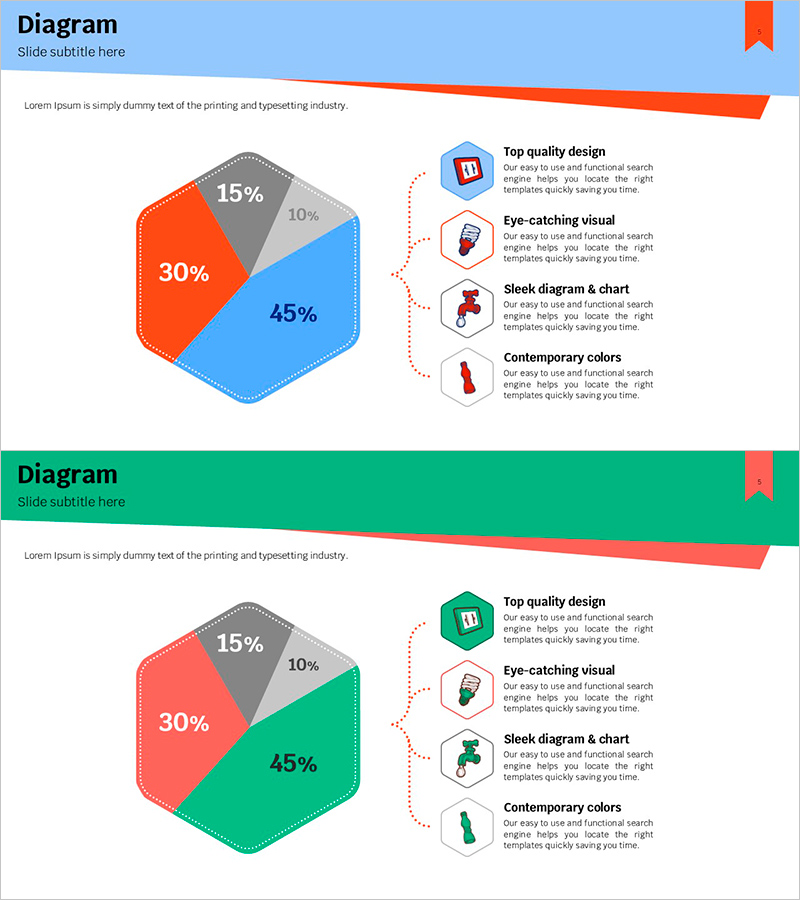
A 2-slide PowerPoint presentation featuring renewable energy percentages displayed in a hexagonal pie chart format. The data is divided into 4 segments using blue, orange, gray, and green colors, with corresponding energy icons positioned on the right side. The first slide features a blue header while the second uses a green header, providing design flexibility for different sections of your presentation. Delivered in 16:9 widescreen PPTX format, all chart values, labels, and text are fully editable. Perfect for energy industry reports, sustainability initiatives, environmental policy presentations, and corporate CSR communications.
Usage Points
-
Main Usage
Communicate renewable energy distribution, environmental statistics, and sustainability metrics in a visually compelling way. The hexagonal pie chart offers a modern geometric alternative to traditional circular charts, making data comparison across four categories immediately clear and memorable for your audience.
-
How to Use
Insert this slide into energy sector reports, environmental policy briefings, sustainability conferences, corporate CSR presentations, or climate action initiatives. Double-click the chart values to update with your actual data, and modify the icon labels to match your specific energy categories (solar, wind, hydro, geothermal, etc.).
-
Recommended For
Energy industry professionals, environmental policy makers, sustainability report authors, corporate IR teams, climate scientists, renewable energy consultants, and educators presenting environmental data to stakeholders and decision-makers.
-
Slide Structure
Two-slide layout with color variations (blue and green headers). Each slide contains a hexagonal pie chart divided into 4 segments (45%, 30%, 15%, 10%), four energy-related icons on the right, and accompanying text descriptions. All elements are fully editable in 16:9 widescreen format.
Related Products
-

4 Strategic Keywords to Achieve Goals
#Business Introduction #Diagram #Business Areas
-

Transportation Diffusion Diagram
#Business Introduction #Diagram #Business Areas
-

Magic Performance Guide Diagram – An Engaging and Creative Business Introduction
#Business Introduction #Diagram #Business Areas
-

Sewing Button Diagram – Business Area and Technical Status
#Business Introduction #Diagram #Business Areas
