Key Performance Table Presentation Template
RM0200006_6
- Last Update 02/02/2025
- File Size 0.3MB
- # of Slides 2
- File Format PPTX
- Slide Ratio 16:9
- Color
Keywords
About the Product
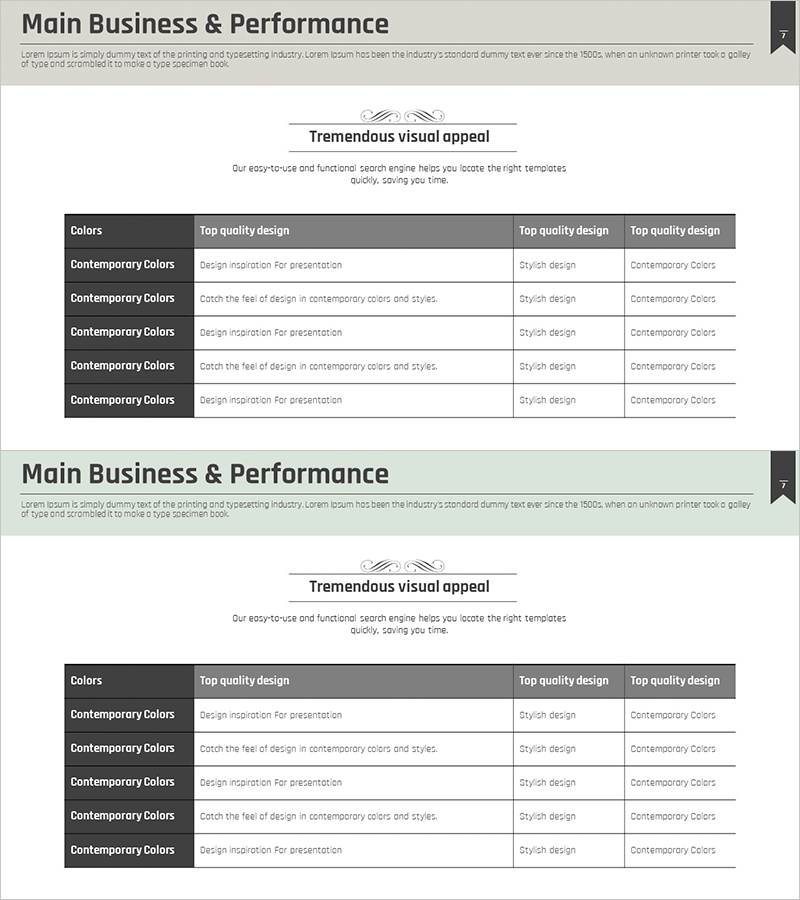
A professional key performance KPI table PowerPoint slide designed to visualize corporate metrics and financial data with clarity. Features a dark gray header row and white background with a 4-column comparison layout, enabling side-by-side analysis of performance indicators, financial figures, and achievement rates. The 2-slide set is optimized for 16:9 widescreen format and supports direct text editing for quick customization. Ideal for investor presentations, executive performance reports, quarterly business reviews, and financial dashboards in PowerPoint.
Usage Points
-
Main Usage
Presents corporate KPI metrics and financial data in a structured table format to support clear communication with stakeholders and investors. Enables effective visualization of quarterly and annual performance comparisons, goal-versus-actual analysis, departmental performance status, and multi-period trend analysis.
-
How to Use
Enter performance metric names (revenue, profit margin, customer satisfaction, etc.) in the dark gray header row, then input corresponding values in the four data columns below. All text and numbers are fully editable, and you can apply color highlighting to visually indicate goal achievement status.
-
Recommended For
Recommended for CFO and finance manager executive reports, investor IR presentations, quarterly performance review meetings, business plan assessments, and consulting proposal performance analysis sections. Suitable for financial services, manufacturing, IT, and service industry performance management presentations.
-
Slide Structure
2-slide set with the first slide containing a title area and 4-column comparison table (5 rows), and the second slide featuring an additional performance metrics table. Each cell supports text input, with dark gray header rows and white data rows for optimal readability and professional appearance.
Related Products
-

Key Performance Indicators PowerPoint Template – Concisely Visualizing Financial Plans and Results
#Company Introduction #Financial Plans and Performance #Diagram
-

Modern Blue Table Chart Presentation Template
#Financial Plans and Performance #Diagram #Balance Sheet
-

Leather Material Presentation Template Table Chart – Financial Performance Visualization
#Financial Plans and Performance #Diagram #Income Statement
-

Rainbow Presentation Template Chart and Icons – Enhance Your Financial Planning
#Financial Plans and Performance #Diagram #Capital Requirements
