Key Performance Indicators PowerPoint Template – Concisely Visualizing Financial Plans and Results
RM0200002_6
- Last Update 02/01/2025
- File Size 0.6MB
- # of Slides 2
- File Format PPTX
- Slide Ratio 16:9
- Color
Keywords
- #Content-Based Slides
- #Design-Based Slides
- #Company Introduction
- #Financial Plans and Performance
- #Diagram
- #Key Achievements
- #Key Financial Indicators
- #Table
- #16:9
- #KPI table PowerPoint slide
- #financial data table presentation
- #key performance indicators PPT design
- #performance metrics slide
- #how to create KPI dashboard in PowerPoint
About the Product
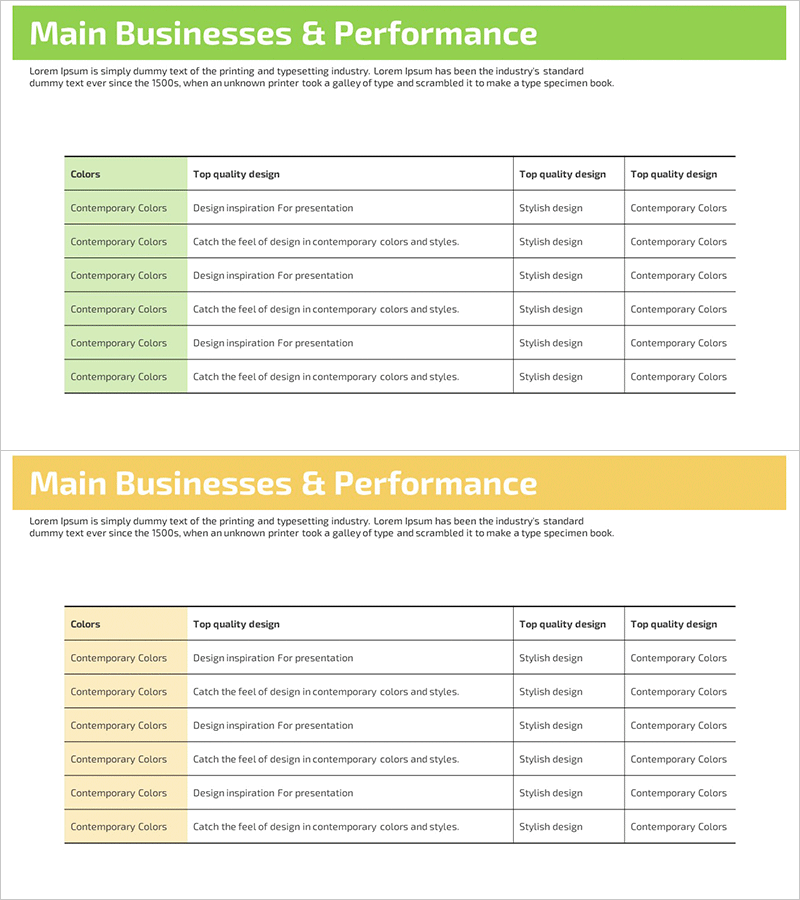
A PowerPoint slide that clearly organizes financial plans and performance metrics in table format. The green header and white background create strong contrast for optimal data readability, with a 3-column structure enabling at-a-glance comparison of KPIs, targets, and actual results. Alternating row colors enhance information hierarchy, and ample text input areas accommodate diverse financial data such as revenue, costs, profit margins, and growth rates. The 2-slide set includes both green and yellow header versions, allowing you to select based on presentation context and brand colors. Fully editable PPTX format.
Usage Points
-
Main Usage
Presents financial performance, KPIs, and key metrics in structured table format to investors, executives, and stakeholders. Enables clear comparison of targets versus actuals, quarterly or annual performance trends, and departmental KPIs using a well-organized layout.
-
How to Use
Insert into business plans, investor pitch decks, management reports, or quarterly earnings presentations in the financial section. Enter metric names (revenue, costs, profit margin, etc.) in the header row and corresponding figures in data rows. Green version suits growth and positive messaging; yellow version emphasizes caution or highlights.
-
Recommended For
CFOs, finance teams, executives, and IR professionals presenting quantitative financial performance. Ideal for investor presentations, shareholder meetings, executive briefings, and departmental performance reviews requiring data-driven decision support.
-
Slide Structure
2-slide set. Each slide contains one title area and one 3-column data table. The table features one header row plus 6-7 data rows with alternating row colors to strengthen information hierarchy. Provides both green-header and yellow-header color variants for flexible application.
Related Products
-

Key Performance Table Presentation Template
#Company Introduction #Financial Plans and Performance #Diagram
-

Leather Material Presentation Template Table Chart – Financial Performance Visualization
#Financial Plans and Performance #Diagram #Income Statement
-

Idea Presentation Wide Table Slide – Financial Performance Overview
#Financial Plans and Performance #Diagram #Cash Flow Statement
-

Modern Blue Table Chart Presentation Template
#Financial Plans and Performance #Diagram #Balance Sheet
