Financial Services System Diagram - Innovative Service Development
RM0200006_20
- Last Update 02/02/2025
- File Size 1MB
- # of Slides 2
- File Format PPTX
- Slide Ratio 16:9
- Color
Keywords
- #Content-Based Slides
- #Design-Based Slides
- #Business Management
- #Technical Approach
- #Diagram
- #Service Development Plan
- #System Architecture Diagram
- #Flow
- #Multidirectional Flow
- #16:9
- #financial services diagram PowerPoint
- #5-step system flowchart
- #multi-directional process slide
- #financial system workflow PPT
- #business process diagram template
About the Product
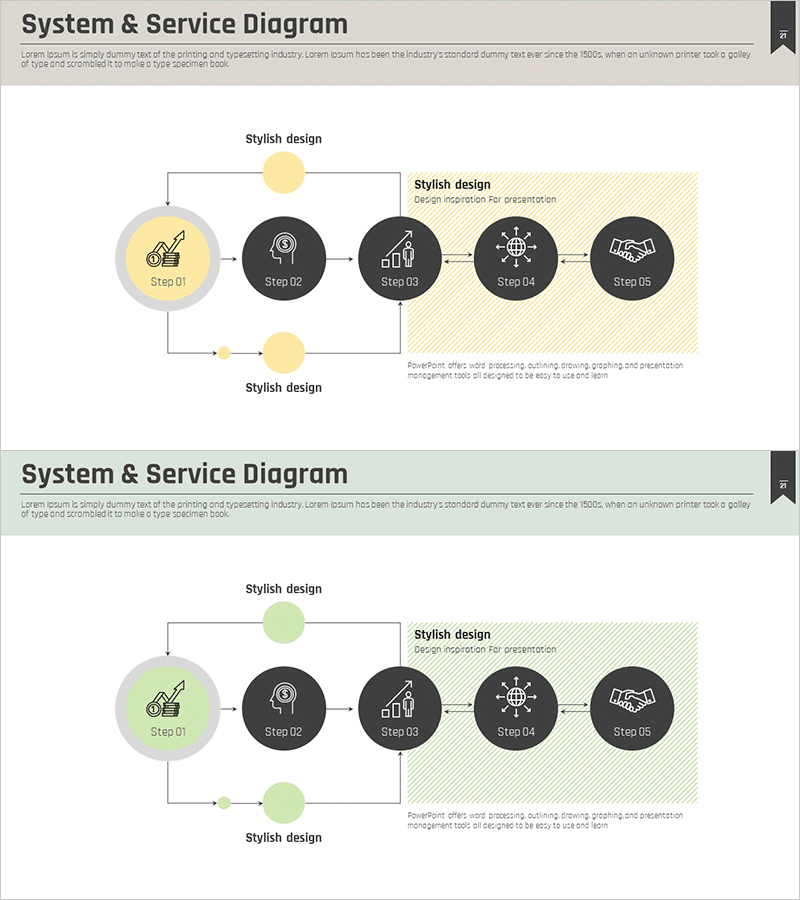
A PowerPoint slide that visualizes the complex financial services system process through a 5-step multi-directional diagram. The design uses contrasting yellow and black tones to emphasize key stages, with circular nodes and arrows representing both linear progression and feedback loops. Optimized for financial institutions to explain service development, system architecture, and business workflows in presentations. The 2-slide set includes color variations (yellow and green versions) allowing you to match your presentation tone. Each node can be customized with department names, responsibilities, or deliverables to track project progress and organizational structure.
Usage Points
-
Main Usage
Explains financial institution service development processes, system architecture, and business workflows using a multi-directional diagram format. Five circular nodes connected by arrows represent both linear progression and feedback mechanisms, making complex systems clear and understandable to stakeholders.
-
How to Use
Use in executive briefings, system development team meetings, and client-facing presentations to explain service development stages. Customize each node with department names, team members, and timelines to clarify responsibility structures, or add deliverables to track project milestones and progress.
-
Recommended For
Ideal for financial and fintech company executives, system architects, project managers, and business analysts. Suitable for anyone needing to visualize service development processes, system implementation phases, or complex organizational workflows in financial presentations.
-
Slide Structure
2-slide set featuring identical 5-step diagrams in yellow and green color schemes. Each slide displays a large circular node (Step 01) on the left, followed by four black circular nodes (Step 02–05) arranged horizontally. Bidirectional arrows connect the nodes and show feedback loops. A highlighted area (yellow or green hatching) on the upper right provides space for additional explanatory text or annotations.
Related Products
-

Service Development Plan Strengths & Weaknesses
#Business Management #Technical Approach #Diagram
-

Service Development Item Classification Diagram – Efficient Business Management
#Business Management #Technical Approach #Diagram
-

Future Technology System Configuration Diagram – Efficient Development Flow
#Business Management #Technical Approach #Diagram
-

System Configuration Organizational Chart Diagram – Visual Tool for Service Development
#Business Management #Technical Approach #Diagram
