System Configuration Organizational Chart Diagram – Visual Tool for Service Development
RM0200010_20
- Last Update 02/04/2025
- File Size 1.7MB
- # of Slides 2
- File Format PPTX
- Slide Ratio 16:9
- Color
Keywords
- #Content-Based Slides
- #Design-Based Slides
- #Business Management
- #Technical Approach
- #Diagram
- #Service Development Plan
- #System Architecture Diagram
- #Structure
- #Tree Diagram
- #16:9
- #system organizational chart PowerPoint
- #two-level diagram template
- #service development flowchart
- #hierarchical structure diagram slide
- #system configuration PPT template
About the Product
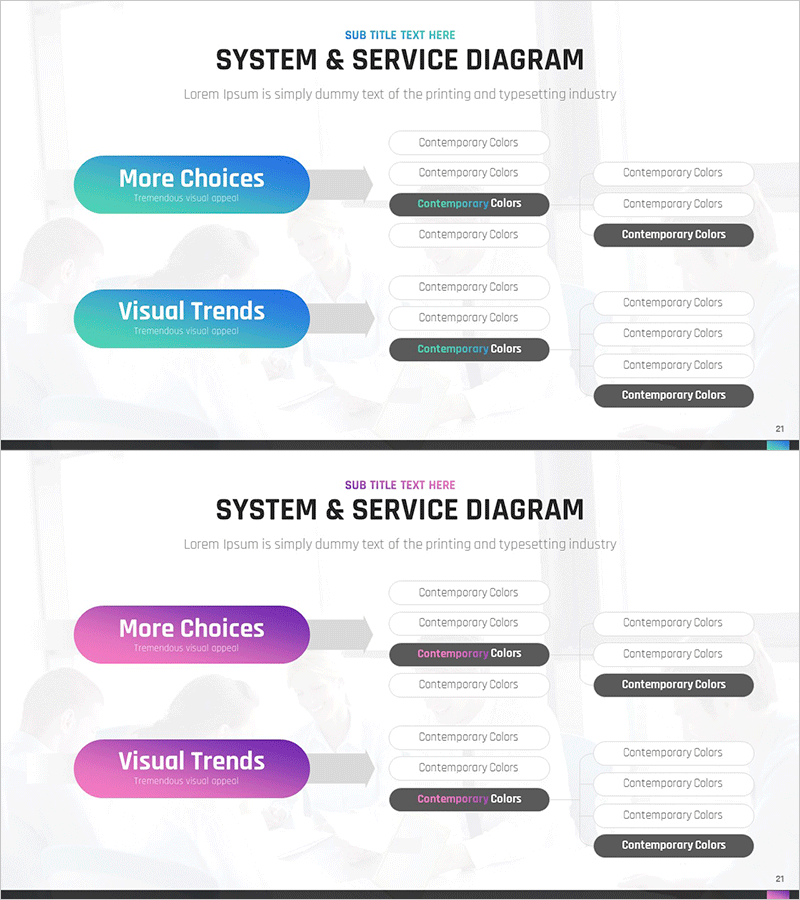
A two-level system configuration organizational chart PowerPoint slide that visualizes service development processes and system architecture. The hierarchical structure expands from primary items on the left (More Choices, Visual Trends) to detailed components on the right, clearly representing system architecture and service structure. Provided in two color versions—turquoise blue and magenta—with fully editable text boxes for each node. Arrows and connector lines emphasize the logical flow from high-level concepts to detailed items, making it immediately applicable to technical documentation, system design presentations, and service development reports.
Usage Points
-
Main Usage
Expresses service development processes, system architecture, and organizational structures in a hierarchical format. Uses arrows and connector lines to clearly visualize the logical flow from high-level concepts to detailed sub-items, making complex system configurations easy to understand and communicate.
-
How to Use
Double-click each node's text to customize for your project. Enter primary item names on the left and detailed elements on the right, then select your preferred color version (turquoise or magenta) for your presentation. Additional levels can be added by duplicating and modifying shapes as needed.
-
Recommended For
Ideal for technology leaders, system architects, product managers, and development team leads presenting technical design reviews, system development reports, and service architecture presentations. Suitable for IT companies, software development firms, and digital service planning teams in internal reporting and client presentations.
-
Slide Structure
Two-slide set, each displaying a two-level hierarchical structure. Primary items (two rounded capsule-shaped text boxes) are positioned on the left, connected via center arrows to five to six detailed elements (rectangular and circular text boxes) on the right. Formatted in 16:9 widescreen ratio for optimal compatibility with modern projectors and online meeting platforms.
Related Products
-

Business Services Organization Chart – Efficient Service Delivery Structure
#Business Management #Technical Approach #Diagram
-

Activity Plan Structure Diagram – Effective Business Management
#Business Management #Technical Approach #Diagram
-

Introduction to Business Services – System and Service Diagram
#Business Management #Technical Approach #Diagram
-

Financial Services System Diagram - Innovative Service Development
#Business Management #Technical Approach #Diagram
