Business Services Organization Chart – Efficient Service Delivery Structure
RM0200012_20
- Last Update 10/07/2025
- File Size 3.3MB
- # of Slides 2
- File Format PPTX
- Slide Ratio 16:9
- Color
Keywords
- #Content-Based Slides
- #Design-Based Slides
- #Business Management
- #Technical Approach
- #Diagram
- #Other
- #Service Development Plan
- #System Architecture Diagram
- #Structure
- #Tree Diagram
- #16:9
- #business organization chart PowerPoint
- #service delivery structure diagram
- #hierarchical organization chart
- #tree diagram slide template
- #organizational structure presentation
About the Product
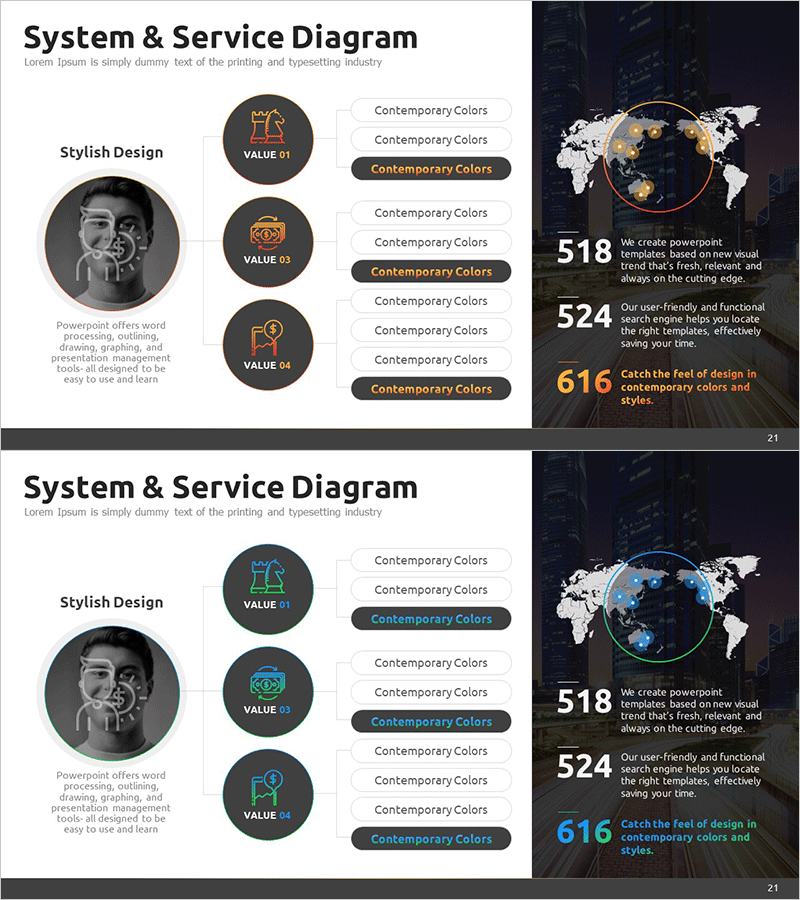
A PowerPoint slide that visualizes business service organizational structure across three hierarchical levels. Dark background with gold-tone circular icons and connecting lines clearly represent departmental relationships and service delivery flow. Left side features a stylized image with descriptive text, while the right side displays a world map visualization and key performance metrics to emphasize global business context. Includes 2 slides with base organization chart and color variations (gold and blue accents). Optimized for modern 16:9 widescreen presentations in fully editable PPTX format for immediate use.
Usage Points
-
Main Usage
Clearly communicate organizational hierarchy and service delivery structure through visual diagram. Enables executives, stakeholders, and team members to understand departmental relationships, reporting lines, and cross-functional collaboration at a glance during presentations.
-
How to Use
Insert into company overview sections of corporate presentations, organizational restructuring announcements, or business process documentation. Customize the left image area with executive photos or department logos, and populate the right metrics section with headcount, revenue contribution, or performance KPIs relevant to your organization.
-
Recommended For
Ideal for executives, organizational development specialists, business consultants, and HR professionals presenting organizational structures. Particularly effective for service-based companies, IT firms, and consulting practices emphasizing cross-departmental collaboration and service delivery models.
-
Slide Structure
Each slide features a three-tier tree structure with circular nodes (VALUE 01–04) connected by horizontal lines representing hierarchical relationships. Left panel contains grayscale imagery and descriptive text; right panel displays world map visualization with three key metric boxes (518, 524, 616) to integrate organizational structure with business performance data.
Related Products
-

System Configuration Organizational Chart Diagram – Visual Tool for Service Development
#Business Management #Technical Approach #Diagram
-

Filming Planning Sequence Diagram – Efficient Business Management
#Business Management #Technical Approach #Diagram
-

Introduction to Business Services – System and Service Diagram
#Business Management #Technical Approach #Diagram
-

Business Work System Organization Chart – Maximizing Efficiency Structure
#Company Introduction #Technical Approach #Diagram
