Consumer Reality Analysis Graph – Market Insights and Trends
RM0200006_15
- Last Update 02/02/2025
- File Size 1MB
- # of Slides 2
- File Format PPTX
- Slide Ratio 16:9
- Color
Keywords
- #Content-Based Slides
- #Design-Based Slides
- #Product/Service Introduction
- #Market and Competitor Analysis
- #Graph
- #Development Status
- #Customer Analysis
- #Circles
- #Pie Chart
- #16:9
- #pie chart PowerPoint slide
- #3-segment pie graph template
- #consumer analysis chart
- #market data visualization
- #ratio comparison slide
About the Product
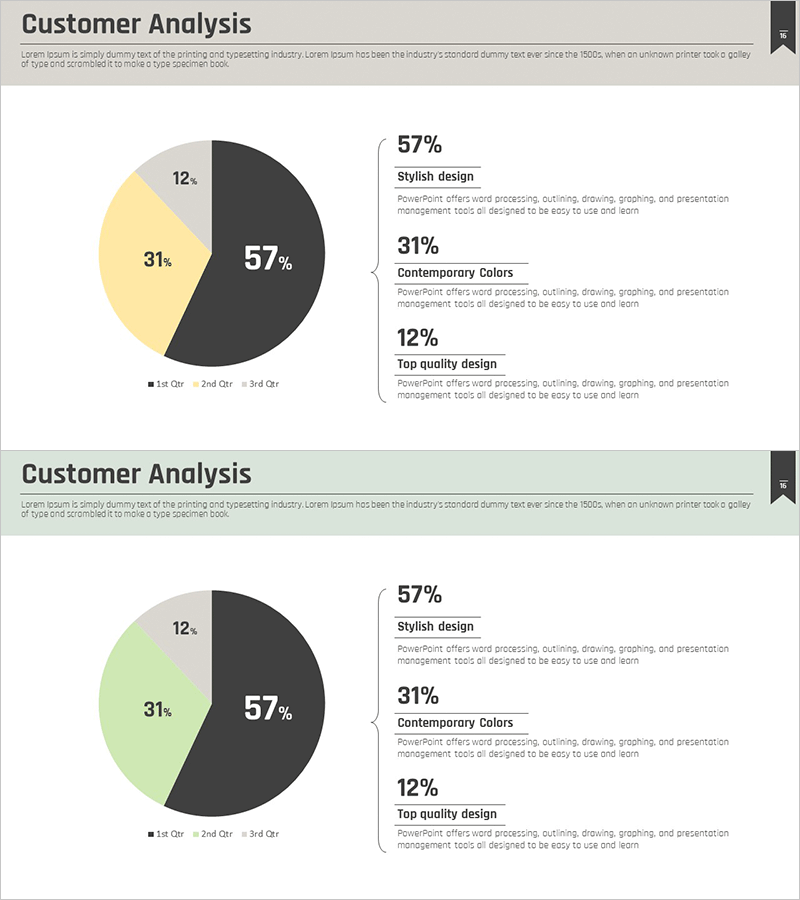
A PowerPoint slide featuring a 3-segment pie chart that visualizes consumer behavior and market trends with clarity and impact. The design combines a dominant charcoal gray section (57%) with complementary yellow and light green segments (31% and 12%), ideal for presenting customer preferences, market share, or quarterly performance metrics. Two slide variations with color options are included in 16:9 widescreen format, allowing flexible presentation of data insights alongside explanatory text. Fully editable PPTX format enables quick customization for marketing reports, business analysis presentations, and customer segmentation materials.
Usage Points
-
Main Usage
Effectively compare and emphasize three-category ratio data such as customer preferences, market share distribution, or quarterly performance metrics. The pie segments with percentage labels and legend provide immediate visual clarity for audience comprehension.
-
How to Use
Double-click pie segments and text boxes to replace values and labels with your data. Select the color variation that matches your presentation tone, then add supporting insights in the right-side text area to reinforce key messages.
-
Recommended For
Marketing professionals presenting market analysis reports, executives delivering quarterly performance reviews, sales teams showcasing customer segmentation strategies, and consultants analyzing industry trends.
-
Slide Structure
Slide 1: 3-segment pie chart with charcoal gray (57%), yellow (31%), and light green (12%) sections, plus right-aligned legend and description text area. Slide 2: Identical layout with color variation (yellow and light green segments swapped) for presentation flexibility.
Related Products
-

Consumer Analysis Pie Chart
#Product/Service Introduction #Market and Competitor Analysis #Graph
-

Manufacturing Analysis Graph – Market and Competitive Analysis
#Product/Service Introduction #Market and Competitor Analysis #Graph
-

Medical Development Status Pie Chart – Visualizing Market Share
#Product/Service Introduction #Market and Competitor Analysis #Graph
-

Development Status Pie Chart – Efficient Data Delivery
#Product/Service Introduction #Market and Competitor Analysis #Graph
