Pie Chart for Market Share Analysis
RJ0400016_15
- Last Update 05/21/2025
- File Size 0.3MB
- # of Slides 2
- File Format PPTX
- Slide Ratio 16:9
- Color
Keywords
- #Content-Based Slides
- #Design-Based Slides
- #Product/Service Introduction
- #Market and Competitor Analysis
- #Graph
- #Development Status
- #Market Share
- #Circles
- #Pie Chart
- #16:9
- #pie chart PowerPoint slide
- #market share analysis template
- #pie graph presentation
- #data visualization slide
- #how to create pie chart in PowerPoint
About the Product
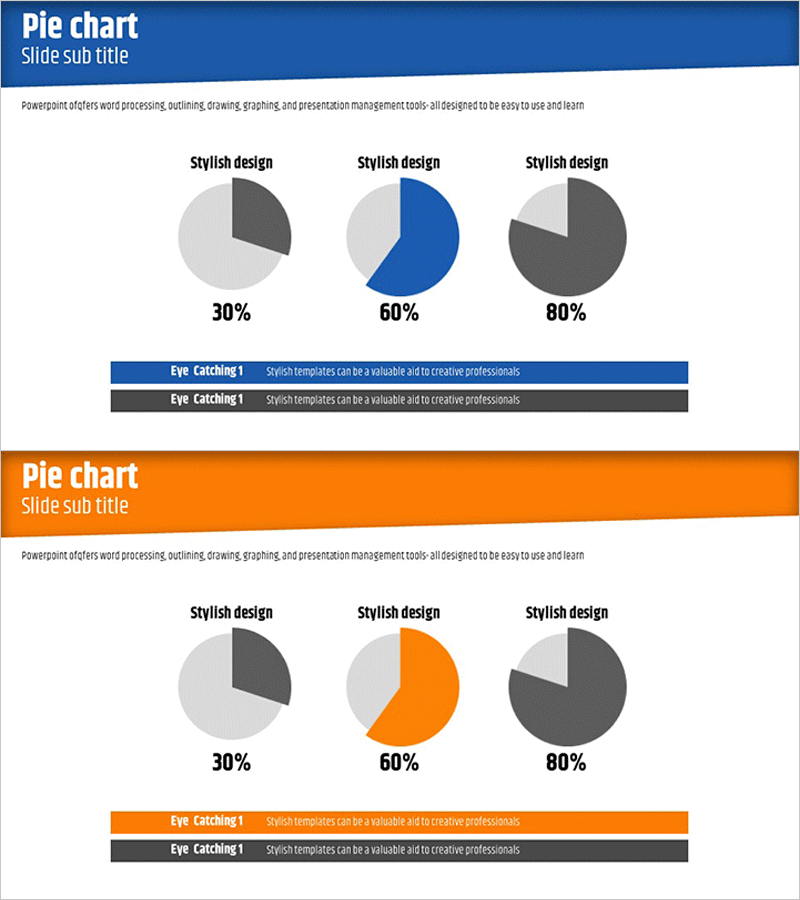
A professional pie chart PowerPoint slide set designed for market share analysis and data visualization. The 2-slide template features three pie charts displaying 30%, 60%, and 80% proportions in blue, orange, and gray color schemes. Each slide includes a header section, three pie charts with distinct segment ratios, and legend text boxes for clear data labeling. Ideal for presenting product market share, customer distribution, revenue composition, and competitive positioning. Fully editable PPTX format allows quick customization of data values and labels for business reports, investor presentations, and marketing strategies.
Usage Points
-
Main Usage
Visualize part-to-whole relationships such as market share percentages, customer segment distribution, revenue breakdown, and product composition. Supports data-driven decision-making in executive reports, investor pitch decks, and marketing strategy presentations.
-
How to Use
Replace the default percentages (30%, 60%, 80%) with your actual data values. Update legend labels in the text boxes to reflect your categories. Choose between blue design for credibility and professionalism, or orange design for energy and positivity. Colors and segment sizes are fully editable.
-
Recommended For
Executives, marketing managers, sales leaders, consultants, financial analysts, and business strategists presenting market analysis, customer segmentation, product positioning, quarterly performance reports, and competitive landscape assessments.
-
Slide Structure
2-slide template. Each slide contains a colored header (blue or orange), three pie charts with varying segment ratios (30%, 60%, 80%), and dual-line legend text boxes at the bottom. Consistent layout enables easy data substitution and brand color customization.
Related Products
-

Development Status Pie Chart – Visualizing Product Progress
#Product/Service Introduction #Market and Competitor Analysis #Graph
-

Brand Awareness Distribution Chart – Market Share Analysis
#Product/Service Introduction #Market and Competitor Analysis #Graph
-

Market Share Analysis Graph & Table – Enhancing Understanding through Data Visualization
#Product/Service Introduction #Market and Competitor Analysis #Diagram
-

Purchase Volume Comparison Analysis Circle Graph – Understanding Market Share
#Product/Service Introduction #Market and Competitor Analysis #Graph
