Consumer Analysis Pie Chart
RM0100002_13
- Last Update 01/24/2025
- File Size 0.4MB
- # of Slides 2
- File Format PPTX
- Slide Ratio 16:9
- Color
Keywords
- #Content-Based Slides
- #Design-Based Slides
- #Product/Service Introduction
- #Market and Competitor Analysis
- #Graph
- #Development Status
- #Customer Analysis
- #Circles
- #Pie Chart
- #16:9
- #pie chart PowerPoint slide
- #pie graph template
- #consumer analysis chart
- #customer distribution slide
- #market share visualization
- #data proportion template
About the Product
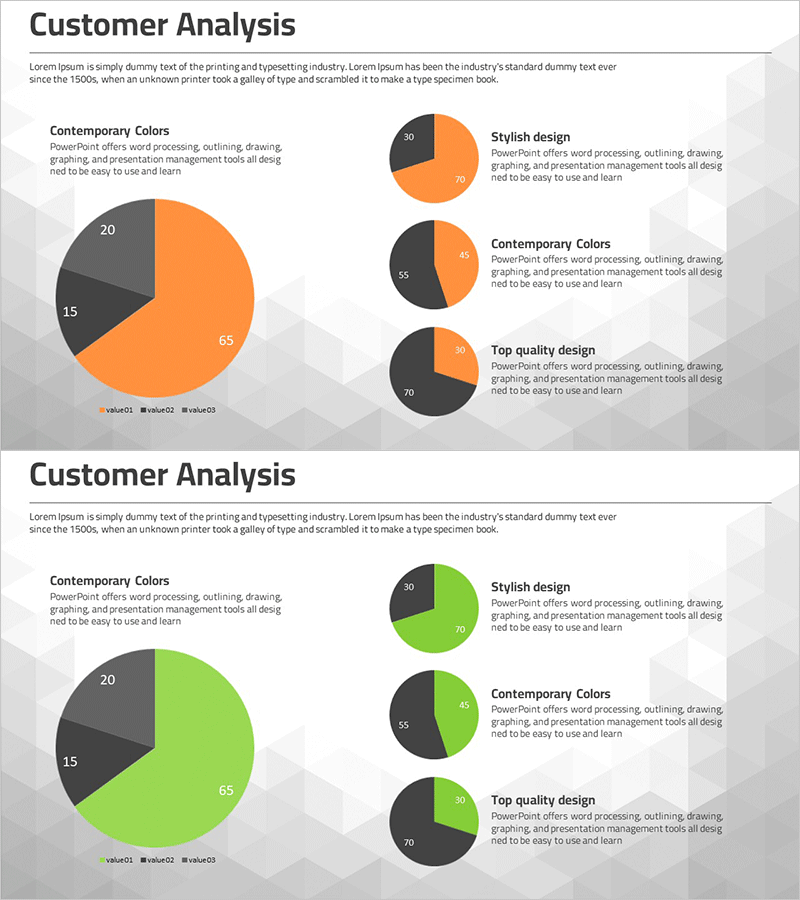
A professional pie chart PowerPoint slide designed for customer analysis and market research presentations. Features a two-tone color scheme combining orange and charcoal to clearly visualize data proportions. The slide set includes one large pie chart with three segments and three smaller pie charts for detailed breakdowns. Each section displays numerical labels and legends, making it ideal for representing consumer segmentation, customer distribution, market share, and demographic analysis. The 16:9 widescreen format includes 2 fully editable slides ready for immediate use. Colors, values, and text can be customized to match your specific data.
Usage Points
-
Main Usage
Visualizes proportional data such as customer segmentation, market share distribution, and consumer demographics using pie charts. The large pie chart displays overall composition while three smaller charts enable detailed item-by-item comparison, supporting multi-layered data analysis and presentation.
-
How to Use
Insert into business plans, marketing strategy documents, or market analysis reports within the customer analysis section. Suitable for executive briefings and client presentations. The warm orange tone effectively communicates positive performance data. Simply replace the sample values and labels with your actual data for immediate presentation use.
-
Recommended For
Marketing managers, sales directors, business planning teams, market research analysts, and consultants presenting customer analysis findings to executives or clients. Particularly effective for consumer behavior analysis, customer satisfaction surveys, and market segmentation strategy presentations.
-
Slide Structure
Slide 1: Title area + large pie chart (3 segments: 65%, 20%, 15%) + legend. Slide 2: Title area + three smaller pie charts (2-3 segments each) + descriptive text areas. Two-tone design using orange (#FF9500) and charcoal (#333333) for strong contrast. All numerical labels and percentages are clearly displayed.
Related Products
-

Consumer Reality Analysis Graph – Market Insights and Trends
#Product/Service Introduction #Market and Competitor Analysis #Graph
-

Pie Chart for Market Share Analysis
#Product/Service Introduction #Market and Competitor Analysis #Graph
-

Medical Development Status Pie Chart – Visualizing Market Share
#Product/Service Introduction #Market and Competitor Analysis #Graph
-

Securities Business Analysis Circle Graph
#Product/Service Introduction #Market and Competitor Analysis #Graph
