Market Environment Analysis with Line Graph and Positioning Map
RM0200001_13
- Last Update 01/31/2025
- File Size 3.5MB
- # of Slides 2
- File Format PPTX
- Slide Ratio 16:9
- Color
Keywords
- #Content-Based Slides
- #Design-Based Slides
- #Market and Competitor Analysis
- #Marketing Plan and Strategy
- #Graph
- #Other
- #Market Analysis
- #Positioning
- #Line
- #Line Chart
- #16:9
- #line graph PowerPoint
- #positioning map slide
- #market analysis presentation
- #competitive analysis PPT
- #marketing strategy template
About the Product
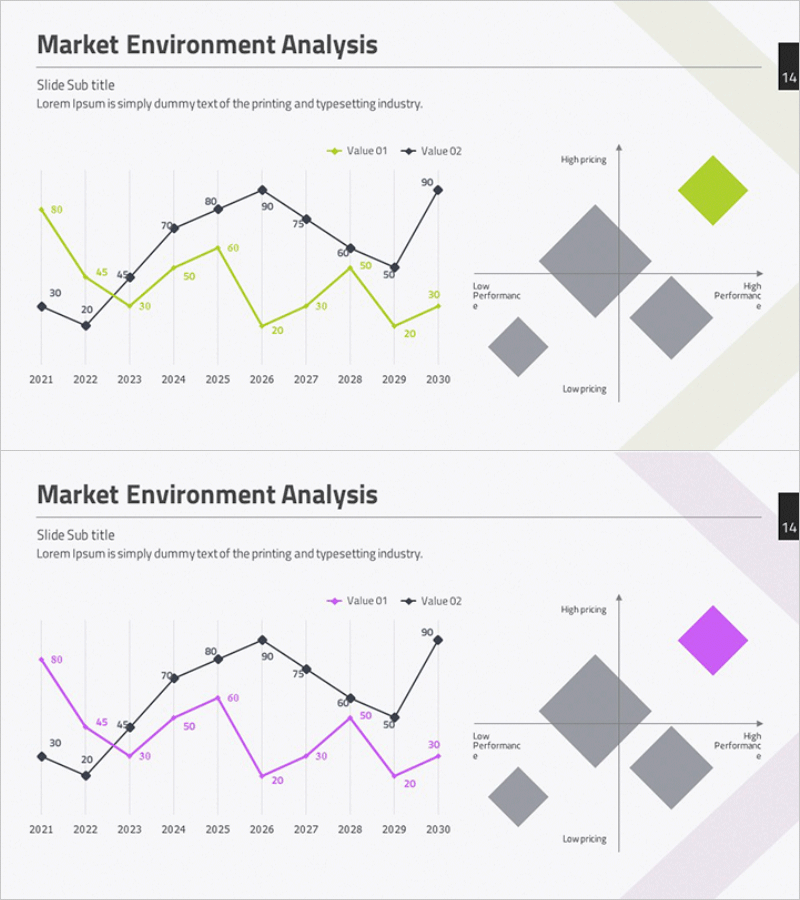
A comprehensive PowerPoint slide combining a dual-series line graph spanning 2021–2030 with a positioning map matrix on the right. The line chart displays two value indicators (yellow and black series) tracking market trends over a decade, while the positioning map uses horizontal and vertical axes to segment competitive positioning into four quadrants. This presentation slide is ready to use for market environment analysis and competitive strategy discussions in business plans, marketing proposals, and investor pitches. Provided in 16:9 widescreen PPTX format with fully editable colors, data points, and labels for customization.
Usage Points
-
Main Usage
Present both market trend analysis and competitive positioning strategy on a single slide. The left-side line graph illustrates how two key metrics evolve over time, while the right-side positioning matrix shows where competitors stand across performance and pricing dimensions.
-
How to Use
Insert this slide into business plans, marketing strategy documents, and investor pitch decks within the market analysis section. Replace the sample data points and axis labels with your actual market research findings, adjust the series colors if needed, and reposition the competitor markers on the matrix to reflect your competitive landscape.
-
Recommended For
Marketing managers, strategic planners, business development teams, management consultants, and executives preparing market analysis presentations. Ideal for B2B companies presenting market opportunities and competitive positioning in proposal documents, board meetings, and investment presentations.
-
Slide Structure
The slide is divided into two main sections. The left side features a dual-series line graph (yellow and black lines) spanning 2021–2030 with data labels at each point. The right side displays a 2×2 positioning matrix with horizontal axis (Low Performance to High Performance) and vertical axis (Low Pricing to High Pricing), containing four gray diamond-shaped quadrants for competitor positioning. A title and subtitle area appears at the top.
Related Products
-

Market Environment Analysis Graph – Deriving Competitive Advantage and Strategy
#Market and Competitor Analysis #Marketing Plan and Strategy #Graph
-

Market Status Analysis & Dot Positioning Map – Understanding Market and Competitors
#Market and Competitor Analysis #Marketing Plan and Strategy #Graph
-

Clothing Market Positioning Map – Strategic Analysis
#Market and Competitor Analysis #Marketing Plan and Strategy #Diagram
-

Competitive Market Positioning Analysis Slide
#Market and Competitor Analysis #Marketing Plan and Strategy #Graph
