Competitor Positioning Graph – Diagram for Market Analysis
RM0100012_25
- Last Update 01/28/2025
- File Size 1.3MB
- # of Slides 2
- File Format PPTX
- Slide Ratio 16:9
- Color
Keywords
- #Content-Based Slides
- #Design-Based Slides
- #Market and Competitor Analysis
- #Marketing Plan and Strategy
- #Diagram
- #Graph
- #Other
- #Market Analysis
- #Positioning
- #Table
- #16:9
- #positioning analysis PowerPoint
- #competitor analysis slide
- #2-axis bubble chart
- #market analysis diagram
- #marketing strategy presentation
About the Product
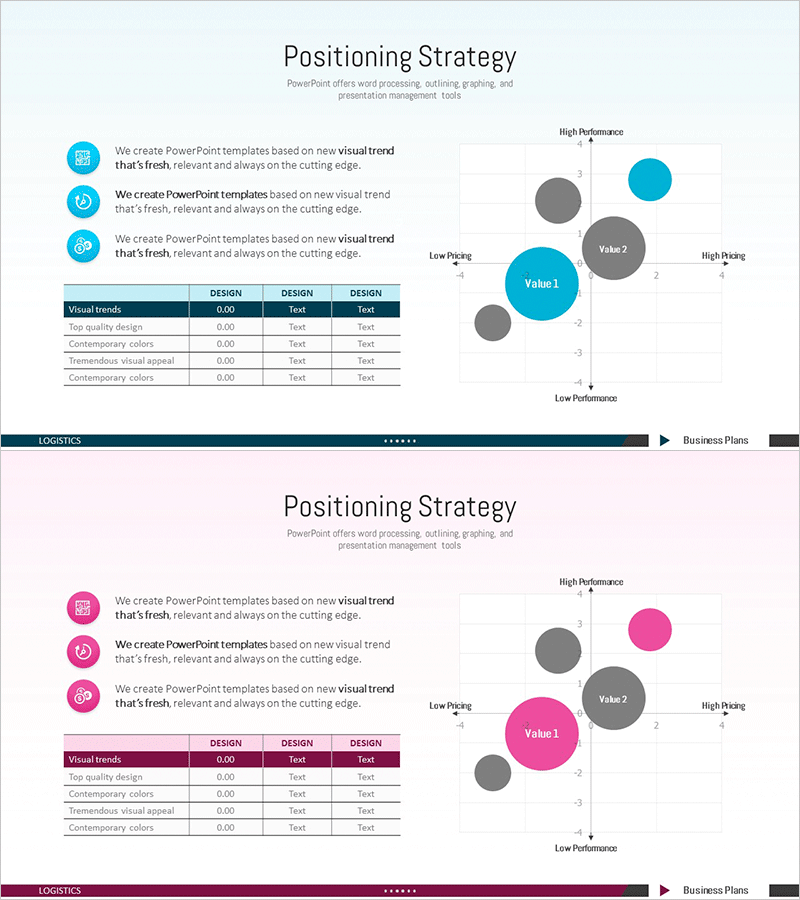
A competitive positioning PowerPoint slide featuring a 2-axis bubble chart that visualizes market dynamics. The layout uses horizontal axis (pricing) and vertical axis (performance) to create a four-quadrant framework with three bubble elements representing competitor positions. Three descriptive text blocks at the top explain the positioning strategy, while a data table in the center provides quantitative metrics for strategic decision-making. Available in three color versions—blue, gray, and pink—in 16:9 widescreen PPTX format for immediate editing and presentation use.
Usage Points
-
Main Usage
Displays the relative market position of your company and competitors using a two-dimensional coordinate system with bubble sizing to represent market share. Simultaneously compares pricing and performance levels to provide evidence-based insights for competitive differentiation strategy.
-
How to Use
Insert into the market analysis section of marketing plans, business proposals, or investor pitch decks. Input competitor data and adjust bubble sizes to reflect actual market share and positioning. Present to executives and investors to communicate strategic market positioning with visual clarity and persuasive impact.
-
Recommended For
Marketing managers, business strategy teams, investor relations professionals, and executives preparing competitive analysis reports. Ideal for highly competitive markets where differentiation strategy is critical or when launching new products requiring clear market positioning.
-
Slide Structure
Slide 1: Title with three descriptive text blocks plus 2-axis bubble chart (four quadrants, three bubbles). Slide 2: Identical layout in pink color variant. Each slide includes a data table (4 rows × 4 columns) supporting quantitative analysis and metric-driven decision-making.
Related Products
-

Market Distribution Analysis Positioning Map – Strengthening Competitiveness
#Market and Competitor Analysis #Marketing Plan and Strategy #Diagram
-

Business Market Positioning Strategy Slide – Competitive Analysis
#Market and Competitor Analysis #Marketing Plan and Strategy #Diagram
-

Positioning Analysis Chart – Market Competitiveness Strategy
#Market and Competitor Analysis #Marketing Plan and Strategy #Diagram
-

Positioning Market Analysis Chart – Understanding Markets and Strategies
#Market and Competitor Analysis #Marketing Plan and Strategy #Diagram
