Analysis of Global Target Regional Distribution Slide
RJ0300074_10
- Last Update 05/09/2025
- File Size 7.3MB
- # of Slides 2
- File Format PPTX
- Slide Ratio 16:9
- Color
Keywords
- #Content-Based Slides
- #Design-Based Slides
- #Company Introduction
- #Market and Competitor Analysis
- #Graph
- #Other
- #Global Network
- #Target Market
- #Horizontal Bar
- #Horizontal Bar Chart
- #Map
- #16:9
- #world map PowerPoint slide
- #global distribution chart
- #regional analysis diagram
- #bubble chart slide template
- #world map presentation template
About the Product
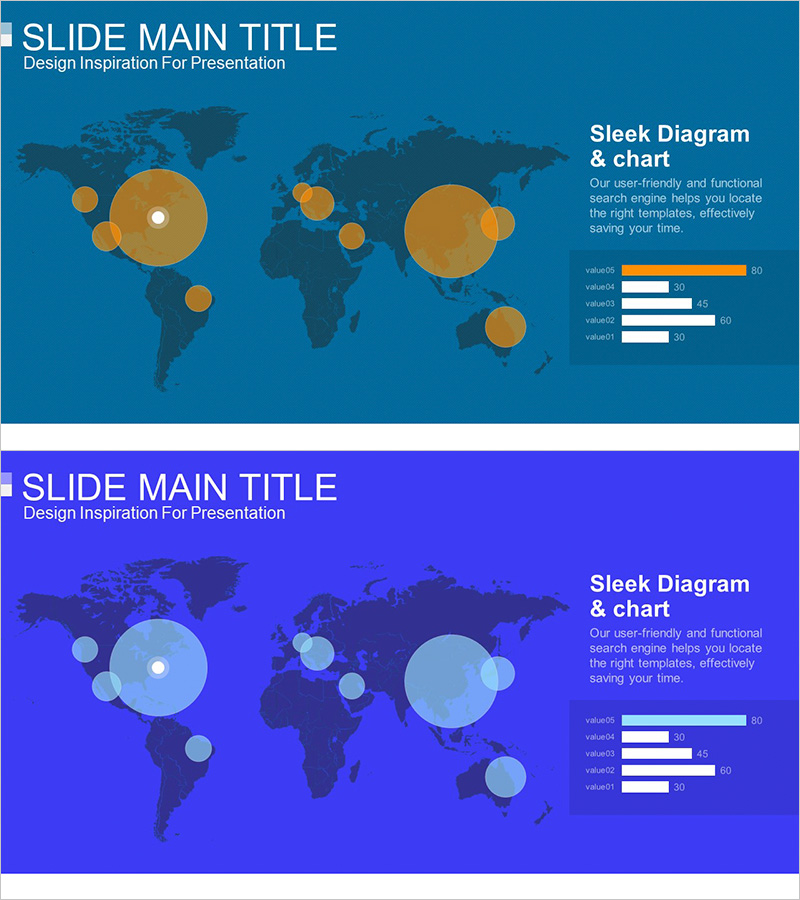
A professional PowerPoint slide set for visualizing global market analysis and regional target distribution using an interactive world map. The design features a dark teal background with golden bubble nodes representing data magnitude across regions, complemented by a horizontal bar chart on the right side for numerical comparison. The 2-slide set includes both a golden-tone and blue-tone version of the same layout, allowing you to match your presentation style. Built with editable shapes in PowerPoint, you can easily input real data and use these slides in business reports, marketing presentations, investor pitches, and strategic planning decks.
Usage Points
-
Main Usage
Ideal for international market expansion strategies, global customer distribution analysis, and regional performance reporting. The bubble nodes on the world map allow instant comparison of regional importance, scale, and performance, while the horizontal bar chart reinforces numerical data for persuasive presentations.
-
How to Use
Adjust bubble sizes and colors to match your actual data, then input the corresponding values into the bar chart. Use these slides in corporate strategy presentations, investor relations meetings, market analysis reports, and international business conferences where global data visualization is essential.
-
Recommended For
International marketing managers, business development professionals, executive reporting teams, management consultants, and export-import company planners. Perfect for presentations on global expansion strategies, regional performance analysis, and international partnership proposals.
-
Slide Structure
2-slide set with identical layout in two color variations (golden and blue tones). Each slide features a world map on the left side (dark background) with 5-7 bubble nodes representing regional data, paired with a 5-item horizontal bar chart on the right for numerical comparison. Formatted in 16:9 widescreen for modern presentation environments.
Related Products
-

Global Target Country Map – Essential Tool for Market Analysis
#Company Introduction #Market and Competitor Analysis #Other
-

Global Market Analysis – Global Network and Target Market
#Company Introduction #Market and Competitor Analysis #Diagram
-

Global Network Target Region Analysis – Stylish Design Visualization
#Company Introduction #Market and Competitor Analysis #Other
-

Target Market Goal Map for Global Market Analysis
#Company Introduction #Market and Competitor Analysis #Other
