City Map & Population Density Insights Slide – Market and Competitive Analysis
RJ0300094_20
- Last Update 05/15/2025
- File Size 2.8MB
- # of Slides 2
- File Format PPTX
- Slide Ratio 16:9
- Color
Keywords
- #Content-Based Slides
- #Design-Based Slides
- #Market and Competitor Analysis
- #Graph
- #Other
- #Target Market
- #Competitive Advantage
- #Horizontal Bar
- #Horizontal Bar Chart
- #Map
- #16:9
- #Europe map PowerPoint
- #population density slide template
- #city map presentation
- #market analysis slides
- #geographic data visualization
- #competitive analysis template
About the Product
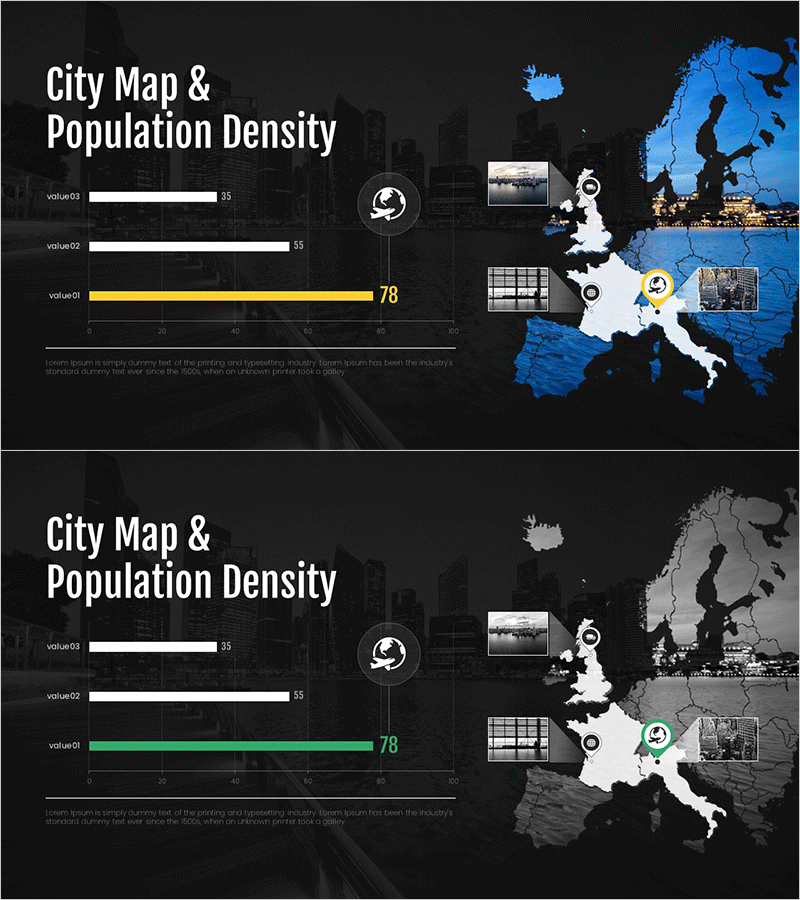
A comprehensive PowerPoint slide set visualizing European city distribution and population density data. The design features a white-background Europe map with blue gradient shading to represent population density levels, paired with three horizontal bar charts (value01–value03) on the left for numerical comparison. Each slide incorporates city photographs, grid layouts, and icons to support market analysis and competitive research. The 16:9 PPTX format enables immediate customization and integration into business presentations.
Usage Points
-
Main Usage
Presents regional market size, population distribution, and competitor locations through geographic visualization. Ideal for investment pitches, business expansion planning, and marketing strategy presentations requiring spatial data clarity.
-
How to Use
Input actual population figures or market metrics into the left-side bar charts, then correlate with city locations on the map. Use city photographs and grid layouts to highlight regional characteristics and differentiation.
-
Recommended For
Executives, marketing managers, business development teams, consultants, and investors. Effective for European market entry strategies, regional sales planning, and global network expansion narratives.
-
Slide Structure
2-slide set. Each slide combines left-side horizontal bar charts (3 data series), right-side Europe map with blue gradient, 3 city photographs, grid layout elements, and icon markers. 16:9 PPTX format.
Related Products
-

Analysis of Global Target Regional Distribution Slide
#Company Introduction #Market and Competitor Analysis #Graph
-

Meat and Vegetable Consumption by Region – Market Status Analysis
#Market and Competitor Analysis #Graph #Other
-

Target Country Market Analysis Graph
#Market and Competitor Analysis #Graph #Other
-

Horizontal Bar Chart Visualizing US Target Market Progress
#Market and Competitor Analysis #Graph #Other
