Distribution Positioning Diagram – Insights for Market Analysis
RJ0300059_8
- Last Update 05/04/2025
- File Size 0.8MB
- # of Slides 2
- File Format PPTX
- Slide Ratio 16:9
- Color
Keywords
- #Content-Based Slides
- #Design-Based Slides
- #Market and Competitor Analysis
- #Marketing Plan and Strategy
- #Graph
- #Other
- #Market Analysis
- #Positioning
- #Other
- #Scatter Plot
- #16:9
- #scatter plot diagram PowerPoint
- #positioning map slide template
- #market analysis PowerPoint
- #competitive positioning chart
- #marketing strategy diagram
- #positioning analysis slide download
About the Product
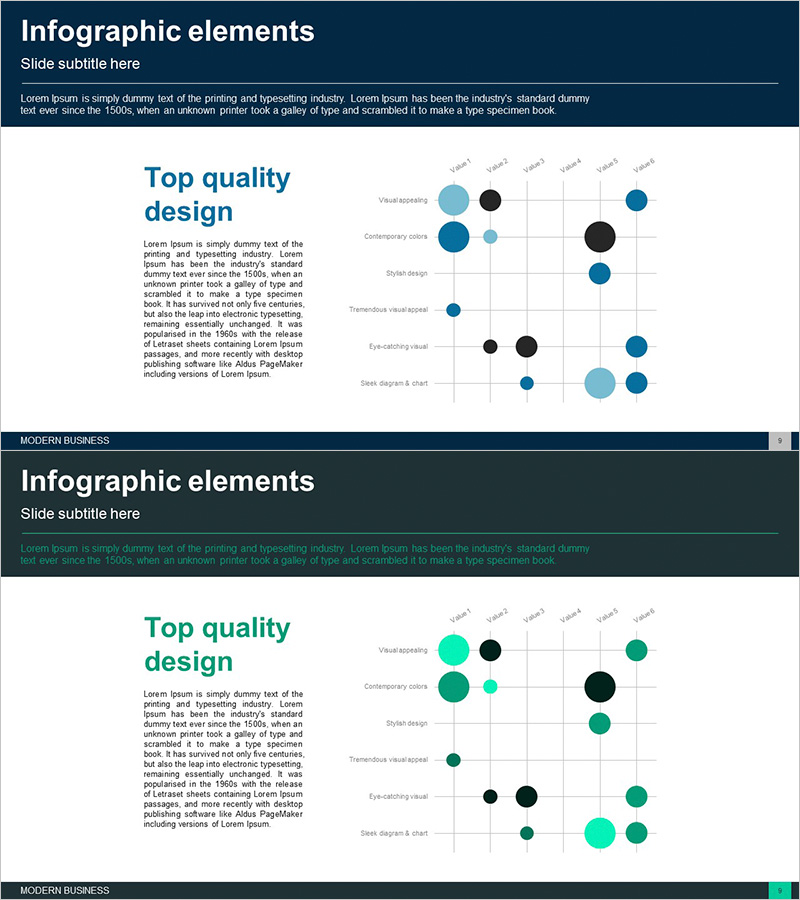
A scatter plot positioning diagram PowerPoint slide designed for market analysis and competitive positioning. This 2-slide template uses a dark blue background with circular nodes in blue and black tones to visualize data distribution across two axes. Each node represents a product, brand, or competitor positioned according to selected evaluation criteria. The grid-based layout enables clear comparison of market positions and competitive gaps. Ideal for marketing strategy presentations, competitive analysis reports, and market segmentation discussions.
Usage Points
-
Main Usage
Visualize product, brand, or competitor positions within a two-dimensional market space defined by key evaluation axes such as price-quality, innovation-reliability, or market share-growth rate. Supports strategic positioning analysis and competitive differentiation planning.
-
How to Use
Customize the horizontal and vertical axis labels to match your analysis criteria. Adjust node positions and sizes to reflect actual data values. Modify colors to distinguish product categories or market segments. Insert into marketing plans, business proposals, and strategy presentations.
-
Recommended For
Marketing managers, strategy planners, product development teams, and business executives. Suitable for new product launch strategies, market entry planning, competitive analysis meetings, and positioning strategy reviews.
-
Slide Structure
2-slide layout featuring a grid-based coordinate system with multiple circular nodes in varying sizes and colors (navy blue, black, light blue). Nodes represent data points positioned by their x-y values, with text labels identifying each item.
Related Products
-

Business Market Positioning Strategy Slide – Competitive Analysis
#Market and Competitor Analysis #Marketing Plan and Strategy #Diagram
-

Competitive Market Positioning Analysis Slide
#Market and Competitor Analysis #Marketing Plan and Strategy #Graph
-

Positioning Diagram – Market Analysis and Strategy
#Market and Competitor Analysis #Marketing Plan and Strategy #Graph
-

Competitor Positioning Graph – Diagram for Market Analysis
#Market and Competitor Analysis #Marketing Plan and Strategy #Diagram
