Capital Sales Analysis Graph – Visualizing Financial Performance
RM0200001_6
- Last Update 02/01/2025
- File Size 3.5MB
- # of Slides 2
- File Format PPTX
- Slide Ratio 16:9
- Color
Keywords
- #Content-Based Slides
- #Design-Based Slides
- #Financial Plans and Performance
- #Diagram
- #Graph
- #Sales and Revenue
- #Key Financial Indicators
- #Table
- #Circles
- #Doughnut Chart
- #16:9
- #donut chart PowerPoint
- #pie chart slide template
- #capital sales analysis graph
- #ratio visualization PPT
- #financial performance chart
- #circular chart presentation download
About the Product
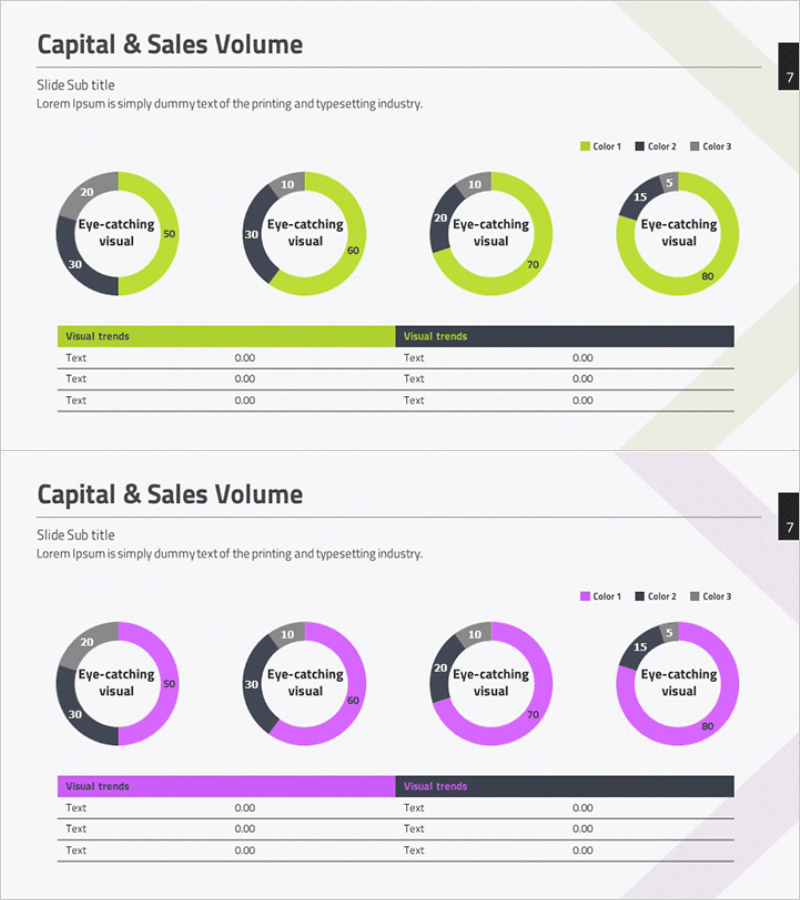
A donut-shaped pie chart PowerPoint slide that intuitively visualizes the proportional relationship between capital and sales volume. The lime green and charcoal gray two-tone color scheme clearly distinguishes data series, while the central text area emphasizes key metrics. This presentation template is optimized for visualizing business indicators such as financial performance analysis, capital composition ratios, and sales channel contribution. The 2-slide set offers multiple color combinations (lime, charcoal, purple) that can be customized to match your corporate brand and presentation topic.
Usage Points
-
Main Usage
Visualizes proportional relationships in financial reports, business performance analysis, capital allocation status, and sales channel contribution. The central text area allows you to place key metrics or messages to focus audience attention on critical data points.
-
How to Use
Use in investor presentations, executive briefings, quarterly performance reviews, and financial analysis presentations to explain capital distribution, revenue composition, and cost ratios. Each data series is designed to automatically reflect proportions when you input values.
-
Recommended For
CFOs, financial managers, executives, business development teams, marketing analysts, and consultants who require data-driven decision-making. Particularly effective when reporting quarterly or annual financial performance to senior management or investors.
-
Slide Structure
Two 4-segment donut charts with lime and purple color combinations. Each slide includes a central text input area, legend (Color 1, 2, 3), and a Visual trends table (3 rows × 2 columns) at the bottom. 16:9 widescreen format, PPTX file type compatible with all Office versions for easy editing.
Related Products
-

Orange Red Point Table – Visualization of Financial Performance
#Financial Plans and Performance #Diagram #Sales and Revenue
-

Key Financial Indicators by Sector – Concise and Stylish Design
#Financial Plans and Performance #Diagram #Sales and Revenue
-

Effective Data Table Slide – Financial Planning and Performance
#Financial Plans and Performance #Diagram #Sales and Revenue
-

Cash Flow and Financial Indicators Correlation Table – Insights on Financial Performance
#Financial Plans and Performance #Diagram #Sales and Revenue
