Sales and Profit Analysis Table – Essential Tool for Presentation
RJ0400051_14
- Last Update 05/31/2025
- File Size 5.4MB
- # of Slides 2
- File Format PPTX
- Slide Ratio 16:9
- Color
Keywords
- #Content-Based Slides
- #Design-Based Slides
- #Financial Plans and Performance
- #Diagram
- #Other
- #Sales and Revenue
- #Key Financial Indicators
- #Table
- #Standard Table
- #16:9
- #sales analysis table PowerPoint
- #profit analysis slide template
- #financial data comparison
- #quarterly earnings presentation
- #revenue report slide
- #business performance table download
About the Product
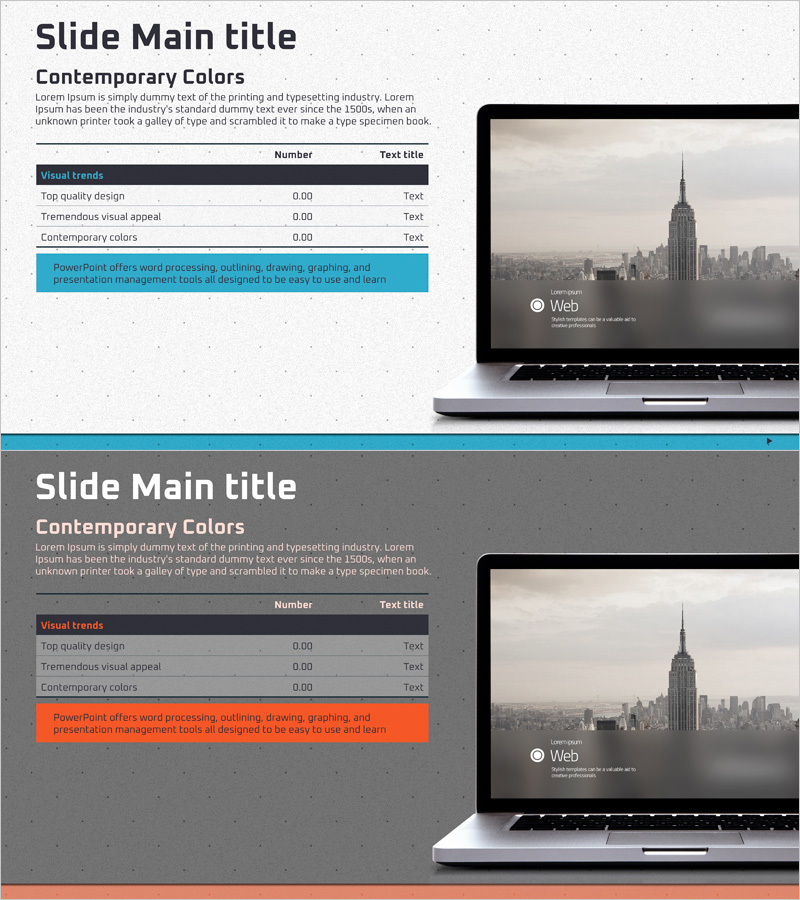
A three-row data table PowerPoint slide designed to compare sales and profit performance at a glance. The slide features a dark header row for visual emphasis and light data entry areas with clearly labeled columns for numbers and text. Ideal for financial performance presentations, quarterly earnings reports, and business plan pitches where quantitative data needs to be communicated effectively. The 2-slide set includes both light and dark background versions, making it adaptable to various presentation themes. All cells are fully editable for immediate customization.
Usage Points
-
Main Usage
Present quarterly and annual sales versus profit figures in a clear, quantitative format that enables stakeholders to quickly understand financial performance. Ideal for executive briefings, investor presentations, and board meetings where precise financial metrics must be highlighted and compared.
-
How to Use
Enter actual sales and profit data into the numeric cells, then update text labels with specific periods or categories. Choose between the light or dark background slide to match your presentation theme, and adjust colors as needed. All text and numbers are fully editable in PowerPoint.
-
Recommended For
CFOs, finance managers, business unit leaders, and executives presenting quarterly or annual results. Also suitable for investor relations presentations, shareholder meetings, internal management reviews, and business plan pitches where financial performance must be demonstrated objectively.
-
Slide Structure
A 3-row by 3-column data table with a dark header row containing category labels and two light-background data rows for numerical or text entries. Strong color contrast between header and data areas ensures visual clarity and easy readability during presentations.
Related Products
-

Line PPT Table (Green & Orange) – Visualizing Financial Performance Data
#Financial Plans and Performance #Diagram #Sales and Revenue
-

Quality PowerPoint Table Template for Financial Performance Visualization
#Financial Plans and Performance #Diagram #Sales and Revenue
-

Colors Theme Presentation Template Table – Financial Planning and Performance
#Financial Plans and Performance #Diagram #Sales and Revenue
-

Orange Hexagon Presentation Template Table – Visualization of Revenue and Profit
#Financial Plans and Performance #Diagram #Sales and Revenue
