System Service Configuration Square Diagram – Visual Composition for Technology Sector
RM0200001_23
- Last Update 02/01/2025
- File Size 3.4MB
- # of Slides 2
- File Format PPTX
- Slide Ratio 16:9
- Color
Keywords
- #Content-Based Slides
- #Design-Based Slides
- #Technical Approach
- #Diagram
- #Service Architecture Diagram
- #System Architecture Diagram
- #Cluster
- #Inclusive Cluster Diagram
- #16:9
- #nested diagram PowerPoint
- #centralized structure slide
- #system composition diagram
- #4-node architecture
- #IT system diagram
- #how to create system diagram in PowerPoint
- #diagram PowerPoint slide template
About the Product
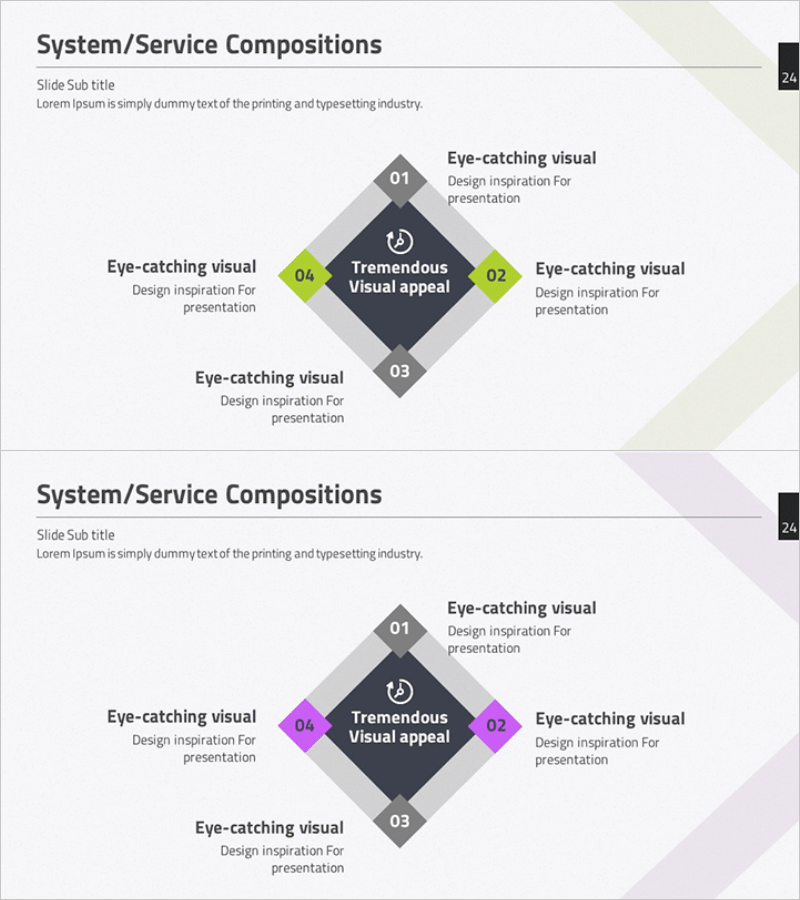
A nested diagram PowerPoint slide that visualizes hierarchical relationships in systems and services using a centralized composition. The central concept is surrounded by four nodes positioned at top, bottom, left, and right, each distinguished by gray hexagons and lime or magenta accent colors. Ideal for explaining complex structures in technology sectors, IT systems, and service architectures. The 2-slide set provides color variations (lime and magenta) for flexible design options. Delivered in 16:9 widescreen PPTX format, fully editable and ready to use.
Usage Points
-
Main Usage
Visualizes centralized relationships for system architecture, IT service composition, organizational hierarchies, and business process flows. Clearly expresses the role and connectivity of peripheral elements around a core concept, making it ideal for technology presentations, system explanations, and service introduction materials.
-
How to Use
Enter the core concept (system name, service name, or organization name) in the central hexagon. Add detailed items (functions, modules, departments, or processes) to the four surrounding nodes. Double-click text and numbers to edit. Choose between lime and magenta accent colors to adjust emphasis levels.
-
Recommended For
IT technical teams presenting system architecture, software development process presentations, cloud service configuration introductions, organizational structure and departmental relationship explanations, business model analysis, and technology consulting proposals.
-
Slide Structure
2-slide set with identical layouts and color variations. Each slide features a dark gray central hexagon (core concept) surrounded by four nodes in lime or magenta accent colors. Each node includes a number (01–04) and text input area. Backgrounds are finished with light beige and lavender geometric patterns.
Related Products
-

Execution Framework Toward Strategic Goals – Effective Business Presentation
#Technical Approach #Diagram #Service Architecture Diagram
-

Multidirectional Flow Diagram for Business System Architecture
#Technical Approach #Diagram #Service Architecture Diagram
-

Tree Structure in Natural Background – System Diagram
#Technical Approach #Diagram #Service Architecture Diagram
-

Chromosome Theme Wide PowerPoint Template – Stylish Diagram Composition
#Technical Approach #Diagram #Service Architecture Diagram
