Visualizing Service Composition with Tree Structure System
RJ0500011_9
- Last Update 06/10/2025
- File Size 4.1MB
- # of Slides 2
- File Format PPTX
- Slide Ratio 16:9
- Color
Keywords
- #Content-Based Slides
- #Design-Based Slides
- #Technical Approach
- #Diagram
- #Service Architecture Diagram
- #System Architecture Diagram
- #Structure
- #Tree Diagram
- #16:9
- #tree diagram PowerPoint
- #hierarchical structure slide
- #organizational chart diagram
- #service composition PPT
- #how to create tree structure in PowerPoint
About the Product
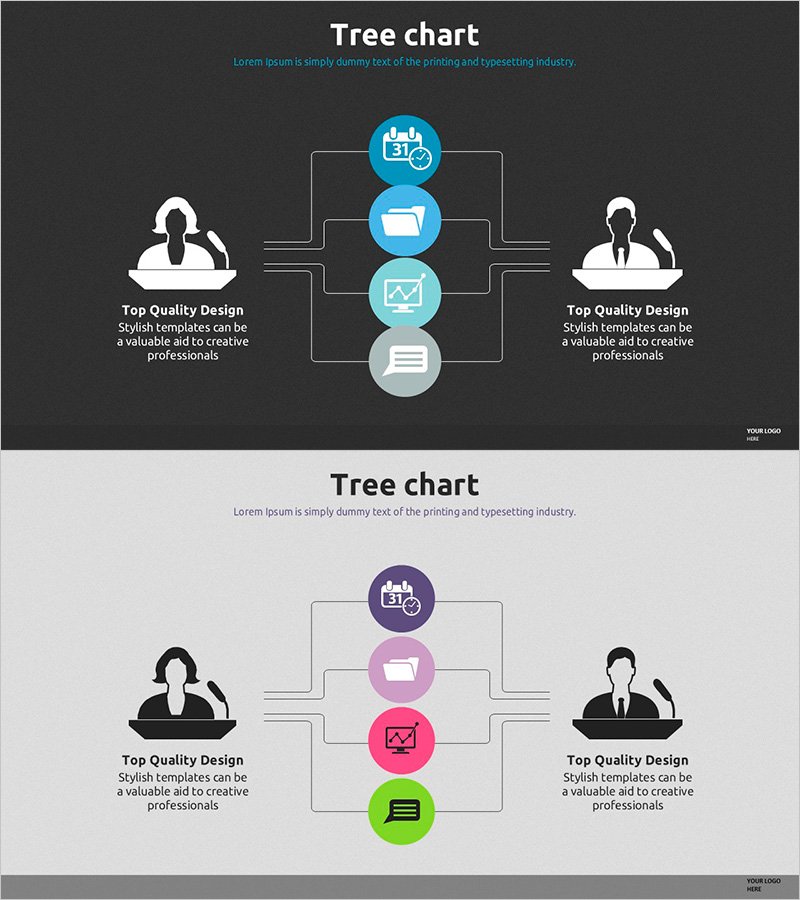
A 4-level tree diagram PowerPoint slide for visualizing service composition and organizational hierarchy. The structure branches from a central top-level node into four hierarchical levels, with each node containing an icon and text area. Designed with a dark gray background, blue circular nodes, and gray connecting lines, flanked by silhouette figures and descriptive text zones on both sides. Ideal for technology presentations, service architecture documentation, organizational structure explanations, system flow diagrams, and strategic planning materials requiring clear hierarchical information display.
Usage Points
-
Main Usage
Clearly visualizes hierarchical relationships such as organizational structure, service composition, system architecture, and decision-making frameworks. The branching structure from top-level concept to subordinate elements enables intuitive understanding and enhances audience comprehension.
-
How to Use
Enter your core concept in the central top-level node, then customize each hierarchical level's icons and text to match your organizational or service structure. Complete the slide by adding role descriptions and characteristics in the left and right text zones.
-
Recommended For
System architecture presentations for IT companies, organizational structure explanations for large enterprises, service portfolio introductions, technical planning documents, consulting proposals, and educational seminar materials.
-
Slide Structure
2-slide set. Slide 1: Dark gray background with centered 4-level tree structure (1 top node → 2 second-level nodes → 2 third-level nodes → 1 fourth-level node), each node in blue circle with icon, silhouette figures and text zones on sides. Slide 2: Light gray background with identical structure featuring purple, pink, and lime green node color variations.
Related Products
-

Auto Business Ops Diagram – Efficiency and Innovation
#Technical Approach #Diagram #Service Architecture Diagram
-

Brown Composition Diagram of the Background of Ingredients – Efficient System Structuring
#Technical Approach #Diagram #Service Architecture Diagram
-

Pet Template Tree Structure – Optimized Visual for Service Diagram
#Technical Approach #Diagram #Service Architecture Diagram
-

Visualizing the Folder Hierarchy and Structure – The Beginning of an Efficient Organization
#Technical Approach #Diagram #Service Architecture Diagram
