Auto Business Ops Diagram – Efficiency and Innovation
RB0700027_4
- Last Update 03/16/2025
- File Size 2MB
- # of Slides 2
- File Format PPTX
- Slide Ratio 4:3
- Color
Keywords
- #Content-Based Slides
- #Design-Based Slides
- #Technical Approach
- #Diagram
- #Service Architecture Diagram
- #System Architecture Diagram
- #Structure
- #Tree Diagram
- #4:3
- #tree diagram PowerPoint
- #hierarchical structure slide template
- #operations system diagram
- #organizational chart PPT
- #process flow PowerPoint slide
About the Product
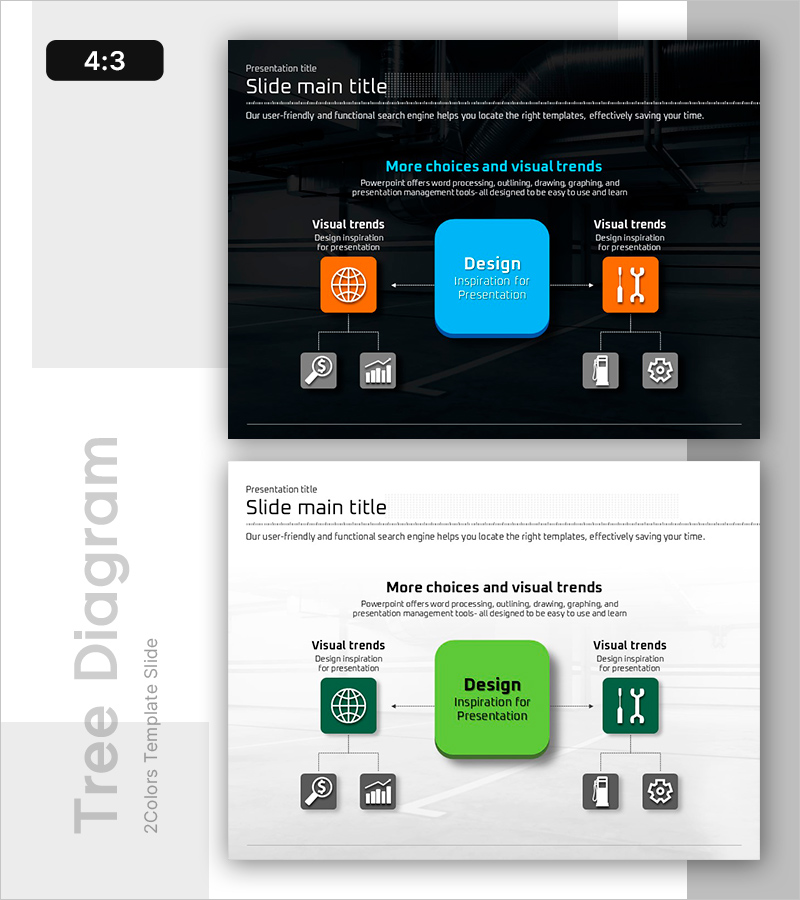
A tree diagram PowerPoint slide visualizing automotive industry operations systems in a 5-tier hierarchical structure. The central blue main node branches left and right to display key functions (Global Network and Tools & Analytics), with gray icon nodes beneath each function representing detailed operational elements. The contrast between dark background and colorful icons clearly distinguishes information hierarchy, making it immediately applicable for presentations, business reports, and strategic planning documents explaining organizational structures, process flows, and system architectures. Includes 2 slides with both dark and light theme versions.
Usage Points
-
Main Usage
Optimized for clearly expressing organizational structures, operations systems, and process hierarchies in tree format. The central main node branches left and right to convey logical flow from high-level concepts to detailed sub-elements visually. Highly effective for explaining complex systems in automotive, manufacturing, IT, and financial sectors.
-
How to Use
Use at the beginning of presentations to explain overall system overview, or insert into business reports' organizational structure and operations framework sections. Edit node text and icons to match your content, and add or remove nodes as needed to adjust hierarchy depth. Select either dark or light theme version based on your presentation background.
-
Recommended For
Recommended for executives, planners, consultants, and training managers in automotive, manufacturing, logistics, IT, and finance sectors who need to explain operations systems. Suitable for business plans, strategic planning documents, organizational restructuring reports, system architecture presentations, and educational seminar materials.
-
Slide Structure
2-slide set. Each slide features a central blue main node (Design Inspiration for Presentation) branching to left orange node (Global Network) and right orange node (Tools & Analytics), with 2-3 gray icon nodes beneath each primary node, forming a complete 5-level hierarchical structure. Both dark background and light background versions provided.
Related Products
-

Tablet Shape Structure Diagram – Visualization of Technology and Service Composition
#Technical Approach #Diagram #Service Architecture Diagram
-

Trial Tree Structure – Legal and Service Overview
#Technical Approach #Diagram #Service Architecture Diagram
-

Organizational Structure Analysis - Efficient System Model
#Technical Approach #Diagram #Service Architecture Diagram
-

Execution Framework Toward Strategic Goals – Effective Business Presentation
#Technical Approach #Diagram #Service Architecture Diagram
