Donut Chart for Interior Satisfaction Survey
RJ0900026_9
- Last Update 08/24/2025
- File Size 0.9MB
- # of Slides 2
- File Format PPTX
- Slide Ratio 16:9
- Color
Keywords
- #Content-Based Slides
- #Design-Based Slides
- #Market and Competitor Analysis
- #Customer Success Stories
- #Graph
- #Market Analysis
- #Customer Testimonials and Feedback
- #Circles
- #Doughnut Chart
- #16:9
- #donut chart PowerPoint
- #donut graph slides
- #pie chart template
- #satisfaction survey presentation
- #customer feedback PPT
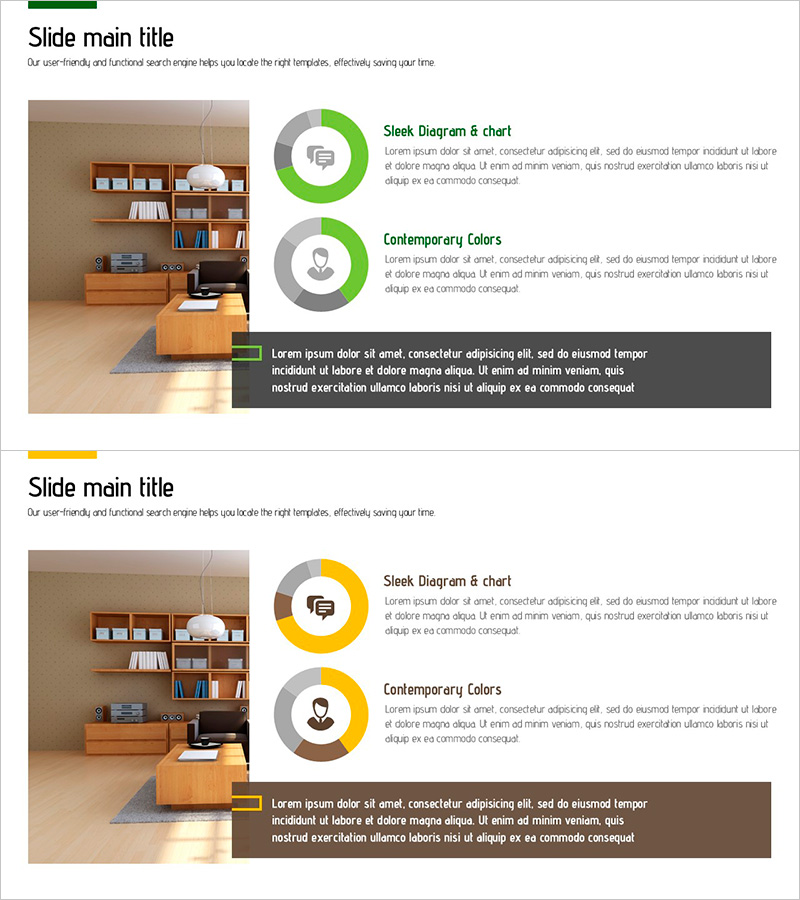
About the Product
A 2-slide PowerPoint presentation featuring donut charts for interior satisfaction surveys, customer feedback, and market analysis. The slides display two donut graphs in gray and yellow color scheme, each paired with icons and text areas for detailed descriptions. Combined with interior space photography, these slides are ready to use in project evaluation reports, customer satisfaction presentations, and competitive analysis materials. Provided in 16:9 widescreen PPTX format with fully editable chart values and colors to match your data.
Usage Points
-
Main Usage
Visualize customer satisfaction, survey results, and competitive ratings using donut graphs. The 2 independent donut charts allow side-by-side comparison of different metrics, such as design satisfaction versus functionality satisfaction in a single view.
-
How to Use
Use in project evaluation reports, customer satisfaction presentations, market analysis materials, and product feedback presentations to highlight proportional data. Simply edit the chart values and colors to match your data, then add item names and descriptions in the text areas.
-
Recommended For
Ideal for marketing teams presenting market research, interior design and construction companies reporting customer satisfaction, product development teams analyzing user feedback, and executives preparing business reports. Especially effective when comparing two proportional metrics simultaneously.
-
Slide Structure
2-slide set with consistent layout. Each slide features interior photography on the left side and two vertically stacked donut charts on the right. Each donut chart uses a gray background circle with yellow accent color to represent proportions, accompanied by icons, titles, and text description areas.
Related Products
-

Premium Coffee Customer Demographics and Popular Menu – Comprehensive Customer Analysis
#Market and Competitor Analysis #Customer Success Stories #Graph
-

Market Analysis at a Glance with Donut Chart – Curved Theme Purple Template
#Market and Competitor Analysis #Graph #Market Analysis
-

Status Analysis Thin Donut Chart - Visualizing Shareholder Status in PowerPoint
#Company Introduction #Market and Competitor Analysis #Diagram
-

Analyzing ABC District Occupancy with Doughnut Chart
#Market and Competitor Analysis #Graph #Other
