Market Share Status of Premium Cafe Industry
RM0100021_6
- Last Update 01/31/2025
- File Size 6.9MB
- # of Slides 2
- File Format PPTX
- Slide Ratio 16:9
- Color
Keywords
- #Content-Based Slides
- #Design-Based Slides
- #Market and Competitor Analysis
- #Graph
- #Market Status
- #Market Share
- #Horizontal Bar
- #Circles
- #Horizontal Bar Chart
- #Doughnut Chart
- #16:9
- #donut chart PowerPoint slide
- #pie chart template
- #market share analysis PPT
- #circular graph presentation
- #bar chart slide design
- #market status visualization
About the Product
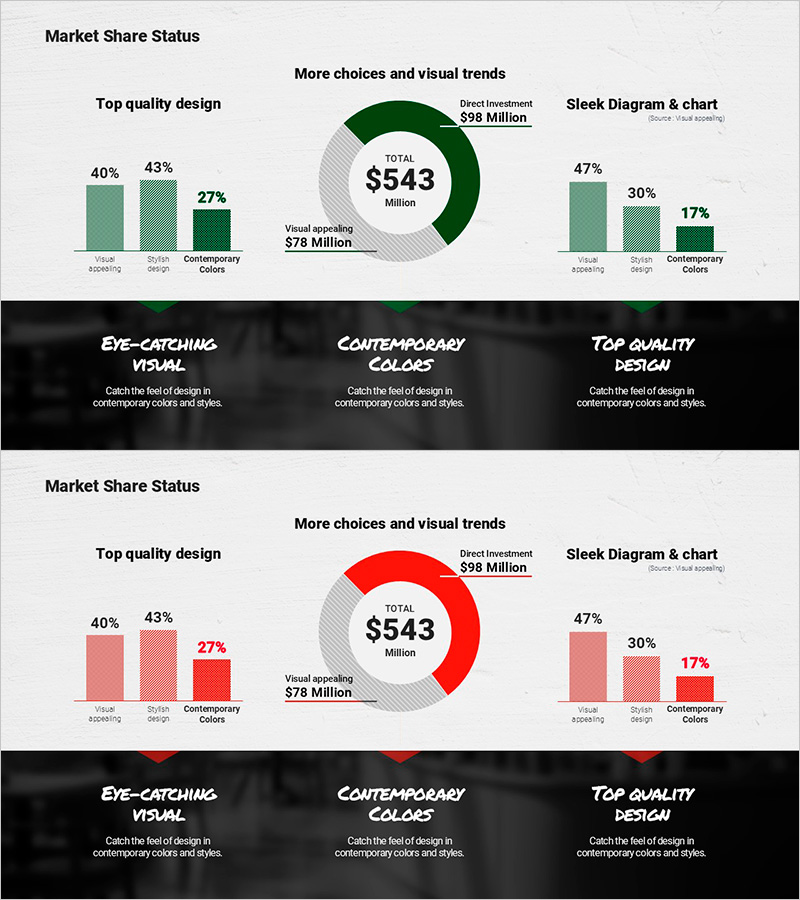
A PowerPoint slide template featuring a donut chart for visualizing market share status with a two-tier data structure. The center emphasizes total investment amount ($543M) while the outer ring displays direct investment ($98M). Complementary horizontal and vertical bar charts on the left and right sides enable category-by-category comparison analysis. The design uses dark green and light green color contrast to distinguish data layers clearly, making it immediately applicable for business presentations and market analysis reports.
Usage Points
-
Main Usage
Visualizes market share, investment volume, and category comparisons in a multi-layered format on a single slide. The donut chart's center highlights total amount while the outer ring displays detailed items, ensuring clear information hierarchy.
-
How to Use
Use in executive reports, market analysis presentations, investor pitch decks, and competitive landscape slides. Left horizontal bars compare item-by-item metrics, right vertical bars emphasize trends, and the center donut represents overall market size.
-
Recommended For
Marketing managers, business planning teams, financial analysts, consultants, and sales executives presenting market conditions. Suitable for industry-specific market analysis presentations in cafe, retail, finance, and manufacturing sectors, as well as quarterly performance reports.
-
Slide Structure
Two-slide set with the first slide featuring a dark green donut chart (center $543M total, outer ring $98M investment), three horizontal bars on the left (40%, 43%, 27%), and three vertical bars on the right (47%, 30%, 17%). The second slide replicates the structure in light red tone, providing color variation options.
Related Products
-

Donut Chart Depicting Market Share – Status of Home Repair Support Projects
#Market and Competitor Analysis #Graph #Market Status
-

Food Nutrient Diagram – Market Share and Status Analysis
#Market and Competitor Analysis #Graph #Market Status
-

Office Desk Donut Chart Analysis – Visualizing Market Share
#Market and Competitor Analysis #Graph #Market Status
-

Distribution of Regulatory Components – Visualizing Market Conditions
#Market and Competitor Analysis #Graph #Market Status
