Cafe Business Initial Investment and Financial Strategy - Path to Success
RM0100021_18
- Last Update 01/31/2025
- File Size 3.9MB
- # of Slides 2
- File Format PPTX
- Slide Ratio 16:9
- Color
Keywords
- #Content-Based Slides
- #Design-Based Slides
- #Financial Plans and Performance
- #Graph
- #Sales and Revenue
- #Tax Strategy and Benefits
- #Horizontal Bar
- #Circles
- #Horizontal Bar Chart
- #Doughnut Chart
- #16:9
- #donut chart PowerPoint
- #pie chart slide template
- #financial analysis PPT
- #investment allocation diagram
- #cafe business financial template
- #circular graph slide
- #how to create donut chart in PowerPoint
About the Product
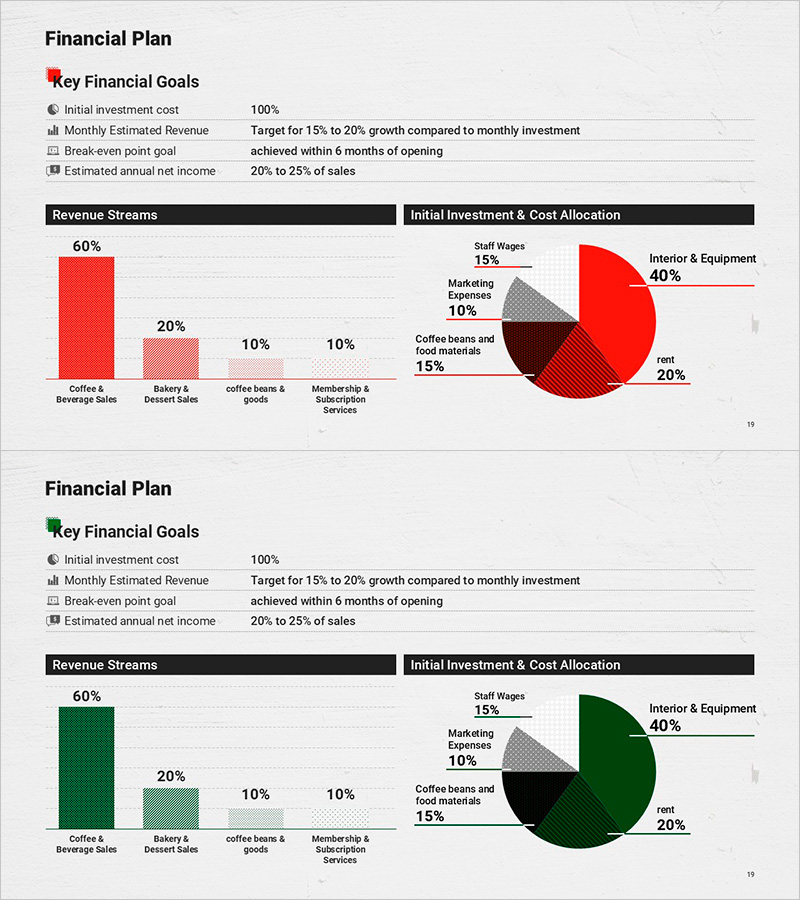
A donut chart PowerPoint slide that visualizes initial investment and financial strategy for cafe business. Provided in two color versions—red and green—this presentation template displays initial investment allocation (interior & equipment 40%, rent 20%, coffee beans & food materials 15%, staff wages 15%, marketing 10%) and revenue composition (coffee & beverage sales 60%, bakery & dessert sales 20%, coffee beans & goods 10%, membership & subscription services 10%) at a glance. Paired with bar graphs for side-by-side comparison, it effectively communicates both investment structure and revenue flow. Ready to use in business plans, investor pitch decks, and financial analysis reports.
Usage Points
-
Main Usage
Visualize cafe business initial investment allocation and projected revenue composition using donut charts to communicate financial planning essentials at a glance. Enables investors, financial institutions, and executives to quickly understand capital flow and profit structure.
-
How to Use
Apply to financial strategy sections in business plans, investor pitch presentations, and cafe startup consulting materials. Combine with key financial goals displayed at slide top (100% initial investment cost, 15-20% monthly revenue growth target, break-even within 6 months, 20-25% estimated annual net income) to build comprehensive financial planning slides.
-
Recommended For
Cafe and beverage shop entrepreneurs, small business consultants, investment review officers, financial analysts, business school instructors, startup education institutions. Ideal for any presentation requiring explanation of initial capital planning or demonstration of investment feasibility.
-
Slide Structure
Two-slide set: first slide features red-toned donut chart showing initial investment allocation across 5 categories; second slide displays green-toned donut chart representing revenue composition across 4 categories. Bar graphs positioned beside each chart reinforce numerical comparison. 16:9 widescreen format, PPTX file type compatible with all PowerPoint versions for easy editing.
Related Products
-

Revenue Breakthrough: Achieving All-Time Highs with Bar Graphs
#Business Strategy #Financial Plans and Performance #Graph
-

Comparing Three Types of Donut Charts – Market Share Analysis
#Market and Competitor Analysis #Financial Plans and Performance #Graph
-

Donut Chart for Beach Travel – Capture Visual Appeal
#Market and Competitor Analysis #Financial Plans and Performance #Graph
-

Sales and Promotion Impact on Financials – Data Visualization
#Marketing Plan and Strategy #Financial Plans and Performance #Graph
