Comparing Three Types of Donut Charts – Market Share Analysis
RB0800034_9
- Last Update 03/25/2025
- File Size 1.4MB
- # of Slides 2
- File Format PPTX
- Slide Ratio 4:3
- Color
Keywords
- #Content-Based Slides
- #Design-Based Slides
- #Market and Competitor Analysis
- #Financial Plans and Performance
- #Graph
- #Market Share
- #Sales and Revenue
- #Circles
- #Doughnut Chart
- #4:3
- #donut chart PowerPoint slide
- #pie chart template
- #ratio visualization
- #market share graph
- #data visualization PPT
- #how to create donut chart in PowerPoint
About the Product
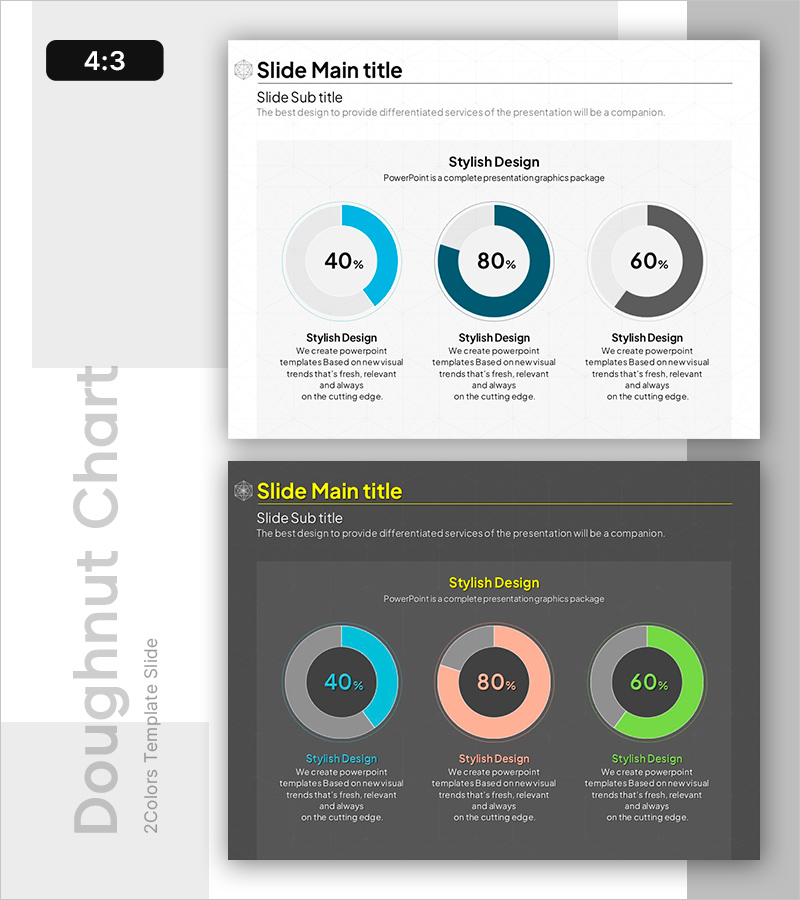
A PowerPoint slide template featuring three donut charts in different color tones to visualize ratio data such as market share, revenue composition, and customer distribution. The light gray background displays donut charts in blue, teal, and gray, allowing the same data to be represented across multiple color variations. Each chart includes a text area below for descriptive analysis, enabling intuitive data communication. This 4:3 aspect ratio, 2-slide presentation is ready for immediate editing and customization.
Usage Points
-
Main Usage
Simultaneously display and compare ratio data using three donut charts in different color tones, enhancing comparative analysis. Ideal for visualizing market share, revenue composition, customer distribution, and product category proportions in business presentations.
-
How to Use
Double-click each donut chart to edit the values and labels. Add analysis content in the text area below each chart. Maintain the three-color scheme or customize colors to match your brand guidelines and presentation style.
-
Recommended For
Recommended for executive presentations on market share and revenue composition in financial and marketing reports, quarterly and annual performance analysis presentations, and product portfolio proportion explanations in sales decks.
-
Slide Structure
2-slide layout with a title slide and a content slide featuring three horizontally arranged donut charts (sample data: 40%, 80%, 60%) with descriptive text areas below each chart. 4:3 aspect ratio PPTX format with fully editable elements for seamless customization.
Related Products
-

Beer Carbonated Doughnut Chart – Market Share Analysis
#Market and Competitor Analysis #Financial Plans and Performance #Graph
-

Market Share Donut Graph – Stylish Data Visualization
#Market and Competitor Analysis #Financial Plans and Performance #Graph
-

Visualizing Real Estate Sales Composition with Doughnut Chart – A Tool for Management Analysis
#Market and Competitor Analysis #Financial Plans and Performance #Graph
-

Car PowerPoint Template Wide - Donut Chart for Market Share Analysis
#Market and Competitor Analysis #Financial Plans and Performance #Graph
