Donut Chart for Beach Travel – Capture Visual Appeal
RJ0600106_21
- Last Update 07/19/2025
- File Size 7.2MB
- # of Slides 2
- File Format PPTX
- Slide Ratio 16:9
- Color
Keywords
- #Content-Based Slides
- #Design-Based Slides
- #Market and Competitor Analysis
- #Financial Plans and Performance
- #Graph
- #Market Share
- #Sales and Revenue
- #Circles
- #Doughnut Chart
- #16:9
- #donut chart PowerPoint
- #pie chart slide template
- #ratio visualization PowerPoint
- #donut graph presentation
- #market share chart
- #how to create donut chart in PowerPoint
About the Product
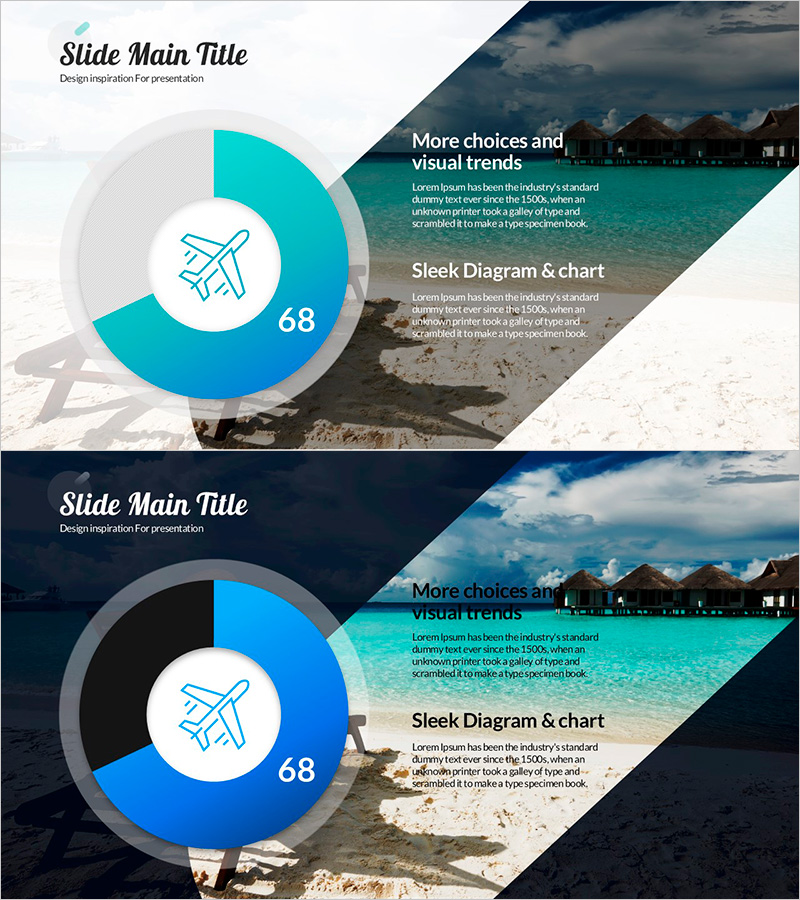
A 2-slide donut chart PowerPoint template featuring a beach travel theme. The turquoise and blue gradient donut chart visually represents market share, sales ratios, composition percentages, and part-to-whole relationships with clarity and impact. An airplane icon and numerical data are centered within the donut to emphasize key information, while the beach background image and diagonal layout add visual interest to your presentation. Designed in 16:9 widescreen format for optimal compatibility with modern projectors and displays. Fully editable PPTX format allows quick customization of data and text.
Usage Points
-
Main Usage
Donut charts excel at displaying part-to-whole ratios and composition percentages. This slide template is ideal for visualizing market share, sales distribution, customer demographics, budget allocation, and time distribution. The centered icon and numerical value draw attention to the most critical data point while the segmented chart shows the complete breakdown.
-
How to Use
Incorporate this slide into the analysis or results section of your presentation when explaining data proportions. The turquoise and blue color scheme conveys trust and stability, making it suitable for business reports, marketing analysis, financial presentations, and quarterly reviews. The beach background imagery is particularly effective for travel, tourism, hospitality, and resort-related projects.
-
Recommended For
Marketing professionals, financial analysts, business planners, tourism and hospitality executives, management consultants, and data analysts presenting quarterly reports, customer analysis, market research findings, budget status, and sales performance. Anyone needing to communicate proportional data clearly to stakeholders will benefit from this template.
-
Slide Structure
The 2-slide set features a centered donut chart with accompanying text area on the right. Each donut is segmented into two colors—turquoise (approximately 68%) and blue (approximately 32%)—with an airplane icon and numerical value positioned in the center. The background combines a beach landscape image with a diagonal split layout for visual balance and modern aesthetics.
Related Products
-

Comparing Three Types of Donut Charts – Market Share Analysis
#Market and Competitor Analysis #Financial Plans and Performance #Graph
-

Visualizing Real Estate Sales Composition with Doughnut Chart – A Tool for Management Analysis
#Market and Competitor Analysis #Financial Plans and Performance #Graph
-

Car PowerPoint Template Wide - Donut Chart for Market Share Analysis
#Market and Competitor Analysis #Financial Plans and Performance #Graph
-

Market Share Donut Graph – Stylish Data Visualization
#Market and Competitor Analysis #Financial Plans and Performance #Graph
