Sales and Promotion Impact on Financials – Data Visualization
RB0800027_8
- Last Update 03/23/2025
- File Size 3.7MB
- # of Slides 2
- File Format PPTX
- Slide Ratio 4:3
- Color
Keywords
- #Content-Based Slides
- #Design-Based Slides
- #Marketing Plan and Strategy
- #Financial Plans and Performance
- #Graph
- #Promotion Strategy
- #Sales and Revenue
- #Circles
- #Doughnut Chart
- #4:3
- #donut chart PowerPoint slide
- #pie chart presentation template
- #ratio visualization PPT
- #data visualization slides
- #financial analysis chart template
About the Product
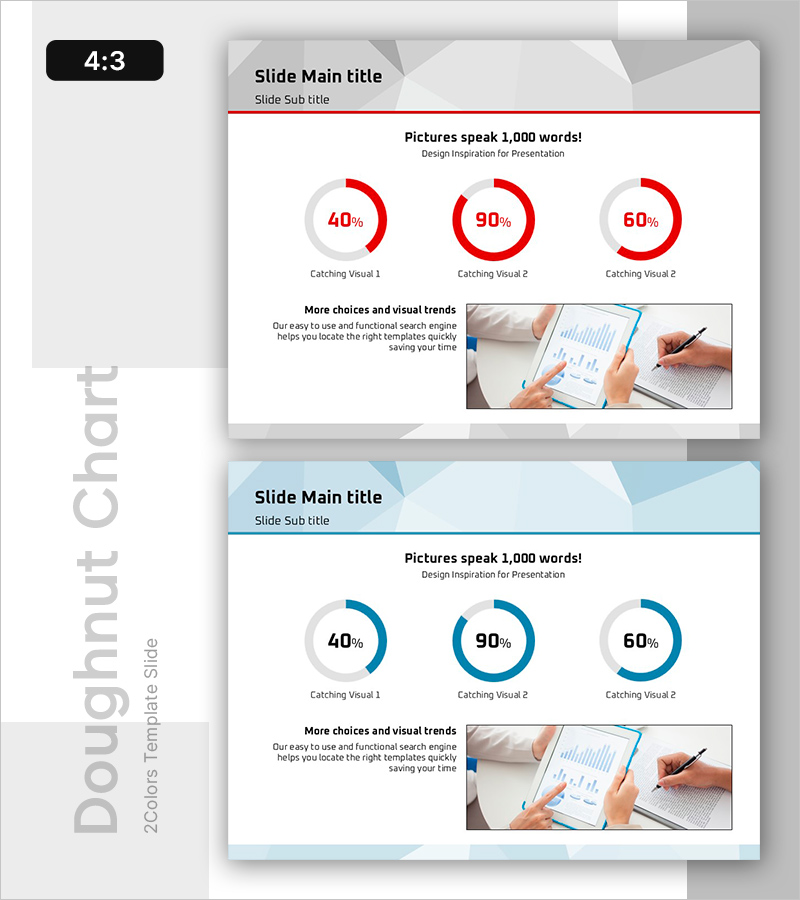
A professional donut chart PowerPoint slide designed to compare sales, promotion impact, and financial metrics through visual ratio representation. Three donut charts in red and blue tones display 40%, 90%, and 60% proportions respectively, with a supporting data analysis image at the bottom to reinforce presentation context. The 4:3 aspect ratio, 2-slide format is ready for immediate editing and customization. Ideal for financial reports, marketing performance analysis, executive briefings, and quarterly business reviews. Each donut chart is independently editable to accommodate various data sets and percentages.
Usage Points
-
Main Usage
Visualize and compare the proportional relationships of three key metrics—sales, promotion, and financial impact—at a glance. The donut chart's center space allows for additional text, icons, or supplementary data, enhancing information clarity and audience engagement.
-
How to Use
Apply to financial reports for revenue composition analysis, marketing presentations for channel performance comparison, and executive dashboards for key performance indicator visualization. Replace chart values and labels with actual data and deploy immediately as a presentation slide.
-
Recommended For
Finance managers, marketing professionals, business analysts, and executive presenters. Recommended for those who need to communicate quarterly results, budget allocation status, revenue channel breakdown, and performance metrics persuasively.
-
Slide Structure
Slide 1: Header section (title and subtitle) + three donut charts (40%, 90%, 60% representation) + label areas. Slide 2: Identical layout with additional image area at bottom for embedding data analysis screenshots or supplementary visuals. Full 4:3 aspect ratio, PPTX format, 2 slides total.
Related Products
-

Simple Circle Presentation Template Doughnut Chart – Visualizing Financial Performance
#Financial Plans and Performance #Diagram #Graph
-

Liquor Sales Chart – Market Analysis and Performance Management
#Market and Competitor Analysis #Financial Plans and Performance #Diagram
-

Visualizing Real Estate Sales Composition with Doughnut Chart – A Tool for Management Analysis
#Market and Competitor Analysis #Financial Plans and Performance #Graph
-

Donut Chart for Beach Travel – Capture Visual Appeal
#Market and Competitor Analysis #Financial Plans and Performance #Graph
