Affiliate Business Sales and Profit Statement – Visualizing Financial Performance in Presentation
RJ0300087_17
- Last Update 05/13/2025
- File Size 0.2MB
- # of Slides 2
- File Format PPTX
- Slide Ratio 16:9
- Color
Keywords
- #Content-Based Slides
- #Design-Based Slides
- #Financial Plans and Performance
- #Diagram
- #Income Statement
- #Sales and Revenue
- #Table
- #Standard Table
- #16:9
- #financial table PowerPoint
- #sales revenue comparison slide
- #profit loss statement template
- #table chart PPT
- #business data visualization
- #financial performance presentation
About the Product
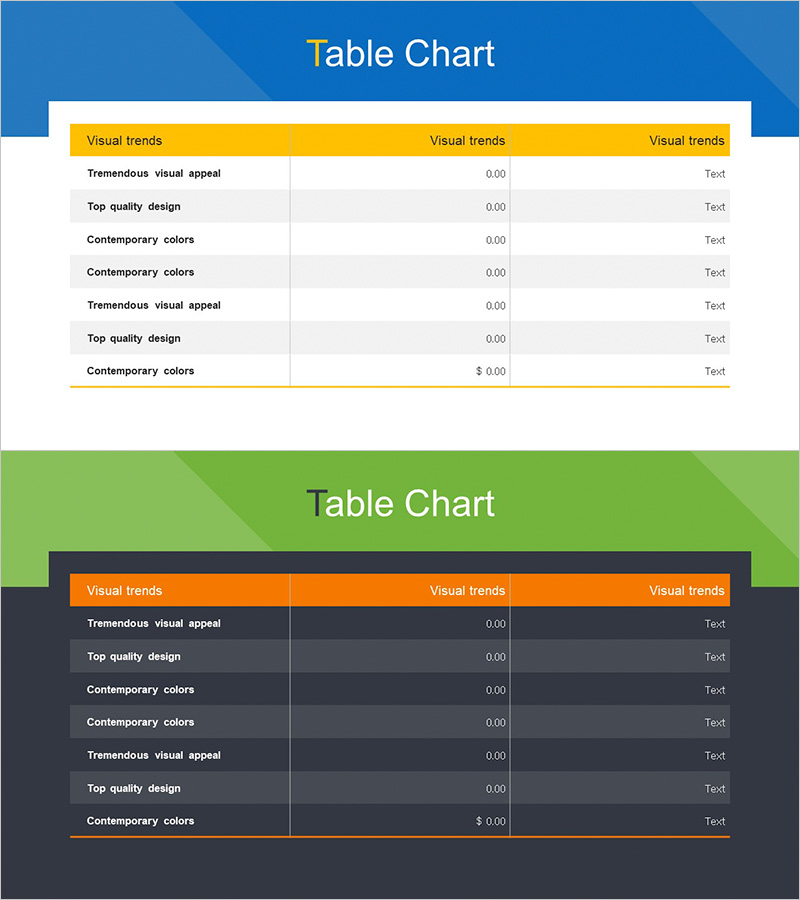
A 3-column financial table PowerPoint slide designed to compare sales and revenue for affiliate business partnerships at a glance. The design features a contrasting golden header with dark gray background, clearly visualizing numerical data. The 2-slide set includes both blue and green tone versions, presenting profit and loss statement items (sales, revenue, expenses, etc.) in organized rows. Immediately applicable for financial performance reporting, business analysis presentations, investor pitch decks, and quarterly earnings calls.
Usage Points
-
Main Usage
Presents financial performance data in a structured table format, enabling side-by-side comparison of sales, revenue, expenses, and other key metrics. The organized row structure of profit and loss items clearly communicates financial status to investors, executives, and stakeholders.
-
How to Use
Use in business analysis presentations, financial reporting decks, investor relations (IR) pitches, and quarterly or annual performance reports. Edit each row's numerical values directly with actual data and select the color version (blue or green) matching your document's tone.
-
Recommended For
CFOs, financial analysts, business analysts, executive reporting managers, and investor relations professionals presenting financial performance. Ideal for affiliate partner evaluations and business division performance comparison presentations.
-
Slide Structure
2-slide set with each slide containing a 3-column (item name, value, text) × 7-row table structure. First slide features blue background with golden header; second slide has green background with orange header, enhancing data readability through color contrast. All cells support numerical input and text editing.
Related Products
-

Business Income Statement Slide - Highlighting Financial Performance
#Financial Plans and Performance #Diagram #Income Statement
-

Income Statement Results Table - Visualizing Financial Performance
#Financial Plans and Performance #Diagram #Income Statement
-

Business Sales and Profit Calculation Table – Essential Slide for Financial Planning
#Financial Plans and Performance #Diagram #Income Statement
-

Sales and Profit Table – Clear Visualization of Financial Planning
#Financial Plans and Performance #Diagram #Other
