Comparative Analysis Bar Graph & Table – Optimized for Market and Competitor Analysis
RJ0400068_19
- Last Update 06/05/2025
- File Size 37.6MB
- # of Slides 2
- File Format PPTX
- Slide Ratio 16:9
- Color
Keywords
- #Content-Based Slides
- #Design-Based Slides
- #Market and Competitor Analysis
- #Diagram
- #Graph
- #Competitor Analysis
- #Market Analysis
- #Table
- #Column
- #Standard Table
- #Column Chart
- #16:9
- #bar graph PowerPoint slide
- #comparative analysis presentation
- #data visualization PPT
- #competitor analysis template
- #market analysis chart
- #table slide design
About the Product
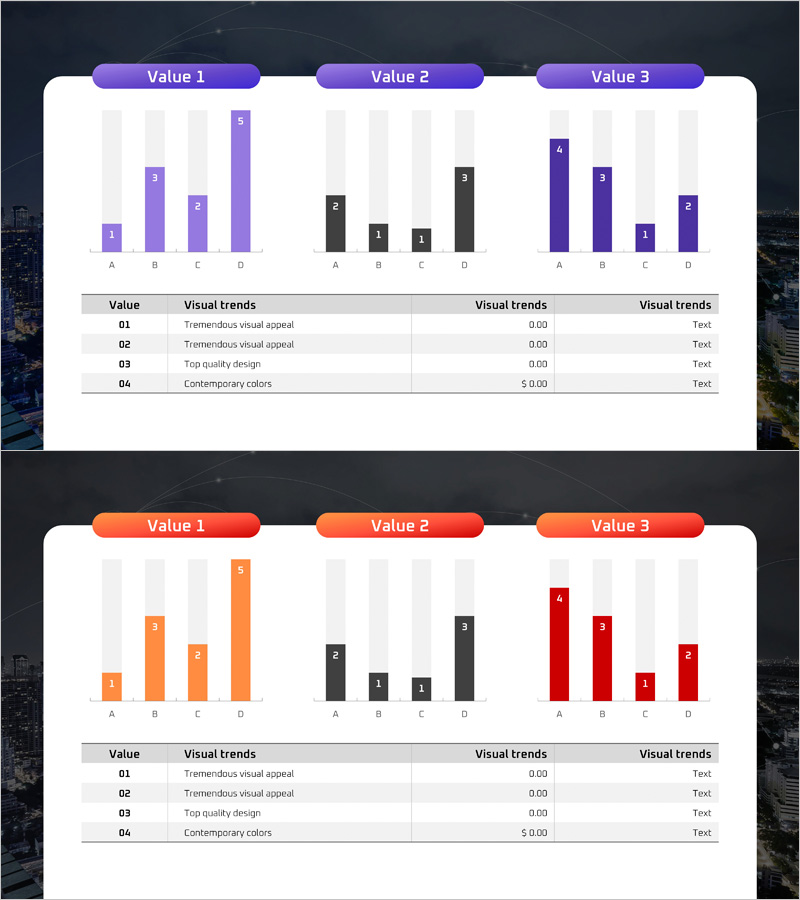
A 2-slide PowerPoint presentation optimized for market and competitor analysis. The first slide visualizes data across 3 categories and 4 items using horizontal and vertical bar graphs, with purple, orange, and red color schemes distinguishing Value 1, 2, and 3. The second slide presents the same data in table format, supporting both numerical comparison and quick data lookup. This presentation template is ready for immediate use in reports, proposals, and business decks, with simple color customization and data entry capabilities.
Usage Points
-
Main Usage
This slide clearly visualizes quantitative data comparisons. The bar graph intuitively shows numerical differences, while the table presents precise figures to enhance presentation credibility. Ideal for market size analysis, competitor performance benchmarking, and product capability comparisons.
-
How to Use
Input your actual data into the first slide's bar graph, and the bar heights automatically adjust. Populate the second slide's table with the same data for audience verification. Color coding is pre-configured by Value, allowing you to present immediately without additional formatting.
-
Recommended For
Recommended for marketing, strategy, sales, and planning professionals. Highly effective in business plans, quarterly reports, competitive analysis documents, and investment proposals where quantitative evidence is critical. Suitable for any business presentation requiring data-driven credibility.
-
Slide Structure
Slide 1: 3 categories (A, B, C, D) with 4 Value data points displayed in horizontal and vertical bar graphs. Color-coded by Value (purple, black, red) for visual distinction. Slide 2: Same data organized in 4-row × 4-column table format emphasizing numerical accuracy. Both slides in 16:9 widescreen format, PPTX compatible with all versions.
Related Products
-

Competitor and Market Analysis Slide Design - Harmony of Blue and Yellow
#Market and Competitor Analysis #Diagram #Graph
-

Cement Theme Bar Graph & Table
#Market and Competitor Analysis #Diagram #Graph
-

Logistics Data by Year Pie Chart – Strategy for Competitor Analysis
#Market and Competitor Analysis #Diagram #Graph
-

Touch Wide Slide Template for Market Analysis with Vertical Column Chart
#Business Strategy #Market and Competitor Analysis #Graph
