Interior Market Share Analysis Donut Graph
RM0100019_11
- Last Update 01/31/2025
- File Size 1.2MB
- # of Slides 2
- File Format PPTX
- Slide Ratio 16:9
- Color
Keywords
- #Content-Based Slides
- #Design-Based Slides
- #Product/Service Introduction
- #Market and Competitor Analysis
- #Graph
- #Development Status
- #Market Share
- #Circles
- #Doughnut Chart
- #16:9
- #donut chart PowerPoint
- #pie chart slide template
- #market share analysis PPT
- #3-segment donut graph
- #market proportion presentation
About the Product
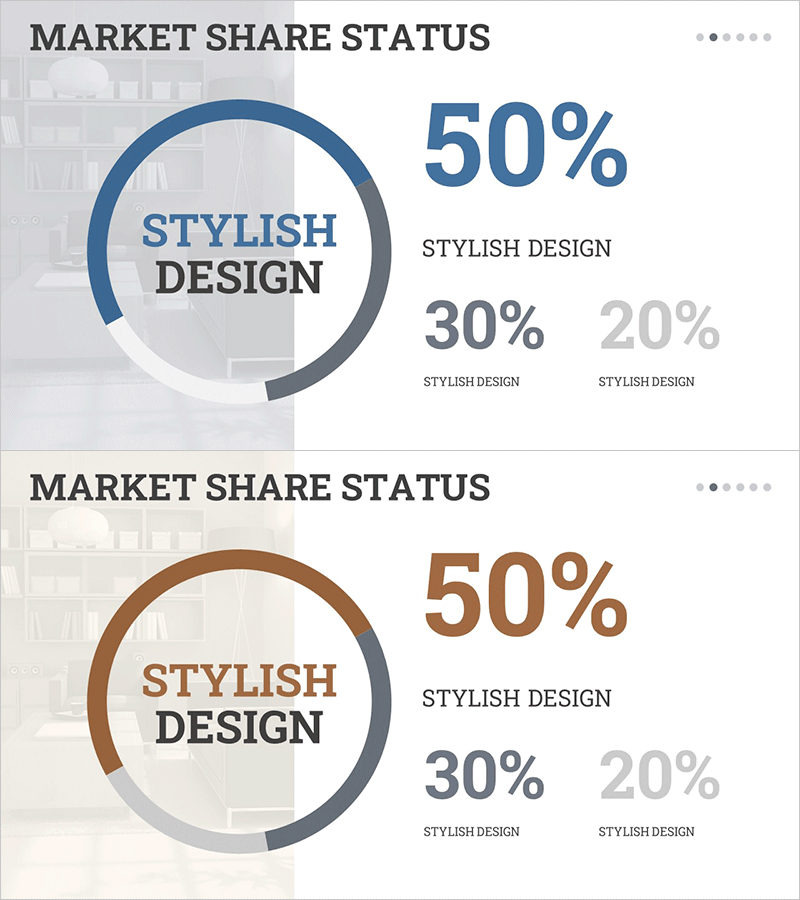
A donut chart PowerPoint slide designed for interior market share analysis presentations. The three-segment circular chart in blue and brown tones visually represents market proportions with clear data hierarchy. This 2-slide deck in 16:9 format features centered text labels within the donut center to emphasize key metrics. The architectural background imagery complements the layout, making it immediately applicable for real estate, construction, and interior design industry presentations. Fully editable PPTX format allows you to customize colors, percentages, and labels to match your specific data.
Usage Points
-
Main Usage
This donut chart is optimized for visualizing market share, market proportions, and composition ratios—showing parts relative to the whole. The centered text area emphasizes key figures or titles, while three segments enable comparison of competitors, market segmentation, and customer composition across various data contexts.
-
How to Use
Use this slide in market analysis sections of real estate, construction, interior design, and retail presentations to explain competitive positioning, customer market share, and sales distribution. Place it in investor pitch decks, business reports, and marketing plans to strengthen credibility with data-driven insights. Edit segment colors and labels to align with your actual data.
-
Recommended For
Recommended for executives, marketing teams, and sales professionals in real estate, construction, interior design, and retail sectors presenting market conditions. Ideal for investor relations materials, executive reports, strategic planning meetings, and client proposals where objective market positioning is critical.
-
Slide Structure
Two-slide deck with each slide featuring a centered 3-segment donut chart. The donut center contains a text input area for emphasizing key metrics or titles. The right side displays a 50%-30%-20% ratio legend with labels. Blue, brown, and gray gradient colors differentiate each segment, while the architectural background reinforces the interior design industry context.
Related Products
-

Analysis of Work Progress – Utilizing Pie Chart
#Product/Service Introduction #Market and Competitor Analysis #Graph
-

Financial Business Analysis Pie Chart – Market Share Insights
#Product/Service Introduction #Market and Competitor Analysis #Graph
-

Analysis graph of market share progress
#Product/Service Introduction #Market and Competitor Analysis #Graph
-

Graph of Analysis of Transportation Development Status
#Product/Service Introduction #Market and Competitor Analysis #Graph
