Visualize Car Sharing Product Service Progress with Diagrams
RM0100018_27
- Last Update 01/30/2025
- File Size 3.2MB
- # of Slides 2
- File Format PPTX
- Slide Ratio 16:9
- Color
Keywords
- #Content-Based Slides
- #Design-Based Slides
- #Product/Service Introduction
- #Technical Approach
- #Diagram
- #Development Status
- #Service Architecture Diagram
- #Cluster
- #Closed Cluster Diagram
- #16:9
- #closed cluster diagram PowerPoint
- #car sharing service progress slide
- #3-node diagram template
- #product strategy presentation
- #business model visualization PowerPoint
About the Product
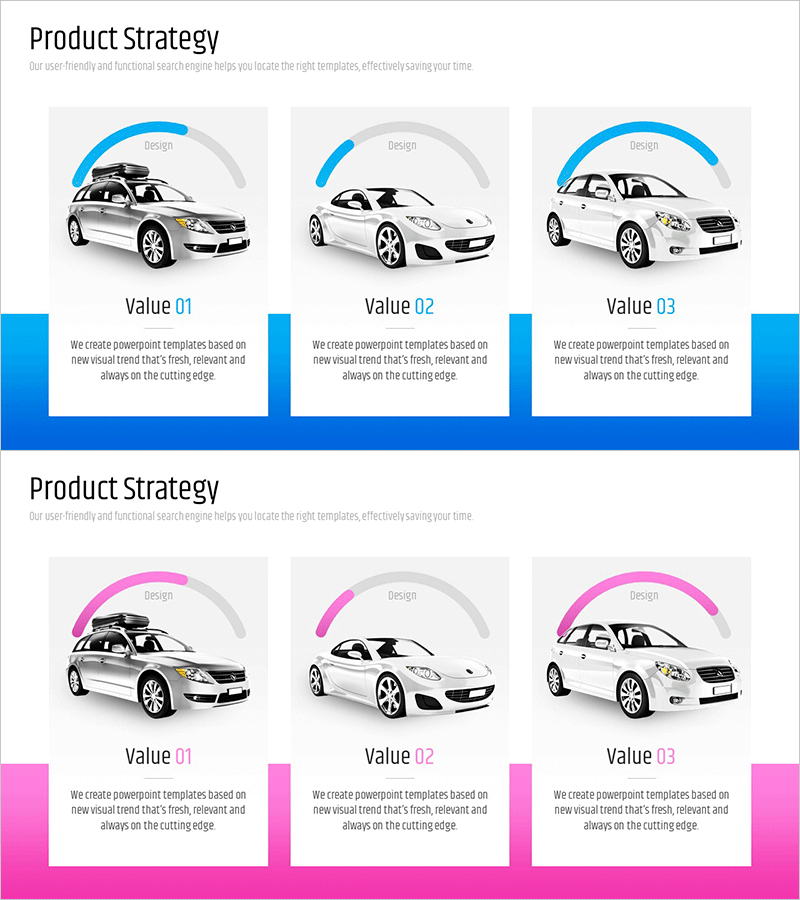
A closed cluster diagram PowerPoint slide visualizing car sharing service progress with three interconnected nodes. The design features a central core concept surrounded by related elements, making it ideal for service strategy presentations and product roadmap discussions. This slide deck combines blue and pink accent arcs with vehicle imagery to create visual impact. Two slides are included—one in blue tone and one in pink tone—allowing you to match your brand colors or presentation theme. Fully editable PPTX format enables quick customization of text and images for various business presentations, from startup pitches to investor meetings.
Usage Points
-
Main Usage
Visualizes service progress stages and relationships between key elements in a single, cohesive view. The closed cluster structure with a central concept and surrounding connected nodes promotes integrated thinking and holistic understanding. Effectively communicates core value propositions and operational components for platform-based services like car sharing, ride sharing, and sharing economy models.
-
How to Use
Use in product strategy presentations, service roadmap explanations, and business model introduction slides. Insert your core service name in the central node and key features, benefits, or operational elements in surrounding nodes to create customized presentations. Suitable for investor pitches, partner collaboration proposals, internal strategy meetings, and stakeholder briefings.
-
Recommended For
Ideal for startup founders, business development managers, product managers, marketing strategists, and executive presenters. Particularly valuable for sharing economy, platform business, and service industry professionals who need to explain complex service structures clearly and concisely to diverse audiences.
-
Slide Structure
Two-slide set featuring identical layouts in blue and pink color schemes. Each slide positions the primary service name centrally with three related element nodes arranged in four directions (top, bottom, left, right) in a closed cluster formation. Vehicle imagery and curved accent elements provide visual cohesion, while all text and colors remain fully editable for customization.
Related Products
-

Service Composition Diagram Circular Diagram – Clustering and Connection
#Product/Service Introduction #Technical Approach #Diagram
-

Business Service Composition Diagram – Intuitive Visualization and Strategic Guidance
#Business Vision and Strategy #Technical Approach #Diagram
-

Corporate Profit Structure Analysis Donut Chart
#Product/Service Introduction #Business Introduction #Diagram
-

Pie Chart of the Development Status of the Snow Mountain Theme
#Product/Service Introduction #Market and Competitor Analysis #Diagram
