Adventure Business Goals Diagram – Key for Strategic Approach
RJ0600055_9
- Last Update 08/28/2025
- File Size 5.9MB
- # of Slides 2
- File Format PPTX
- Slide Ratio 16:9
- Color
Keywords
- #Content-Based Slides
- #Design-Based Slides
- #Product/Service Introduction
- #Marketing Plan and Strategy
- #Diagram
- #Development Status
- #Key Marketing Activities
- #Cluster
- #Closed Cluster Diagram
- #16:9
- #closed-loop diagram PowerPoint
- #3-node circular diagram
- #business goals PowerPoint slide
- #cluster diagram
- #diagram PowerPoint slide template
About the Product
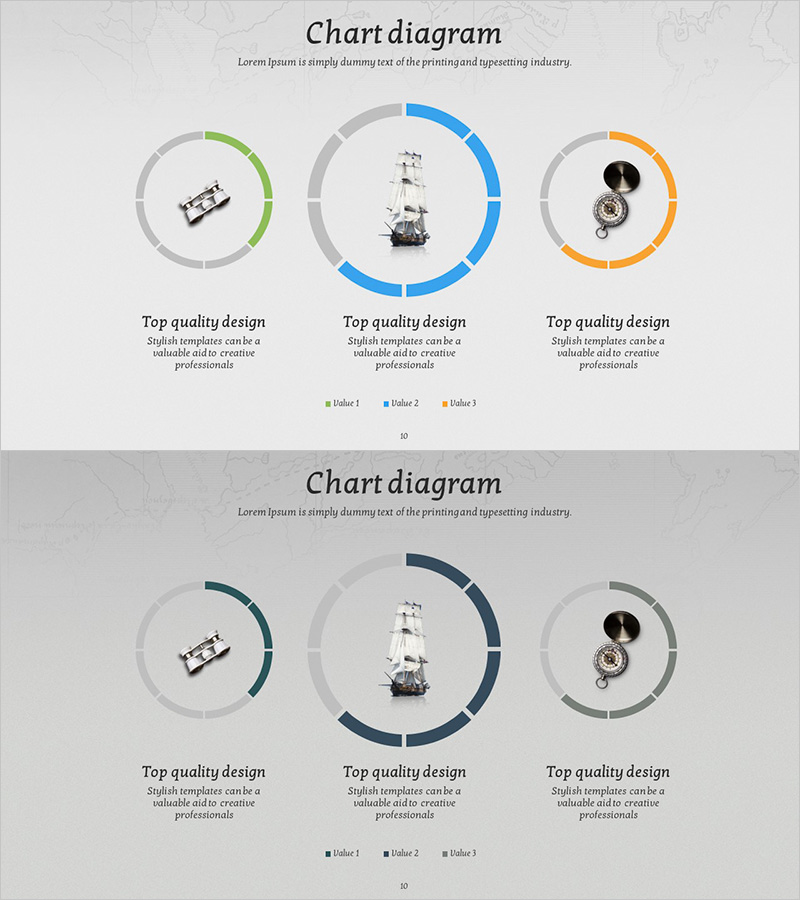
A 3-node closed-loop diagram PowerPoint slide designed to visualize business goals and strategic approaches. Featuring a central image surrounded by three circular ring nodes positioned symmetrically on left and right, each with distinct colors (green, blue, orange) for clear differentiation. This 2-slide, 16:9 aspect ratio PPTX template enables simultaneous representation of three key elements such as marketing strategy, development status, and business objectives. Each node includes a text area below for flexible caption input, making it immediately applicable to business presentations, planning documents, and progress reports.
Usage Points
-
Main Usage
Optimized for simultaneously expressing and visualizing relationships between three core elements such as business goals, strategic approaches, and development status. The symmetrical left-right layout centered on a focal image enables balanced information delivery, while independent color coding of each node ensures clear distinction between items.
-
How to Use
Input key content such as business goals, marketing strategy, and development status into each node's text area, and replace the central image to customize according to your presentation theme. Highly effective when used as strategy explanation or progress update slides in business plans, marketing proposals, and quarterly reports.
-
Recommended For
Ideal for marketing managers, planning teams, and executives explaining business goals and strategies visually. Particularly effective in strategy planning meetings, investor presentations, and quarterly performance reviews where emphasizing the interaction of three core elements is critical.
-
Slide Structure
2-slide composition with each slide featuring a central image area and three symmetrically positioned nodes (green, blue, orange ring structure) on left and right. Each node is enclosed in a circular ring with a text input area below for flexible caption addition.
Related Products
-

Visualizing Key Achievements with Donut Chart Slide – Company and Product/Service Introduction
#Company Introduction #Product/Service Introduction #Diagram
-

Donut Diagram Visualizing Technology Development Status
#Company Introduction #Product/Service Introduction #Diagram
-

Restaurant Blog Slide – Marketing Strategies and Insights
#Marketing Plan and Strategy #Diagram #Marketing Strategy
-

Development Progress and Strategy - Intuitive Cluster Diagram
#Product/Service Introduction #Business Vision and Strategy #Diagram
