Market Share Analysis Graph – Efficient Data Visualization
RM0100018_11
- Last Update 01/30/2025
- File Size 1MB
- # of Slides 2
- File Format PPTX
- Slide Ratio 16:9
- Color
Keywords
- #Content-Based Slides
- #Design-Based Slides
- #Product/Service Introduction
- #Market and Competitor Analysis
- #Diagram
- #Graph
- #Development Status
- #Market Share
- #Structure
- #Circles
- #Tree Diagram
- #Doughnut Chart
- #16:9
- #donut chart PowerPoint slide
- #pie chart template
- #market share analysis graph
- #ratio data visualization
- #circular chart PowerPoint template
About the Product
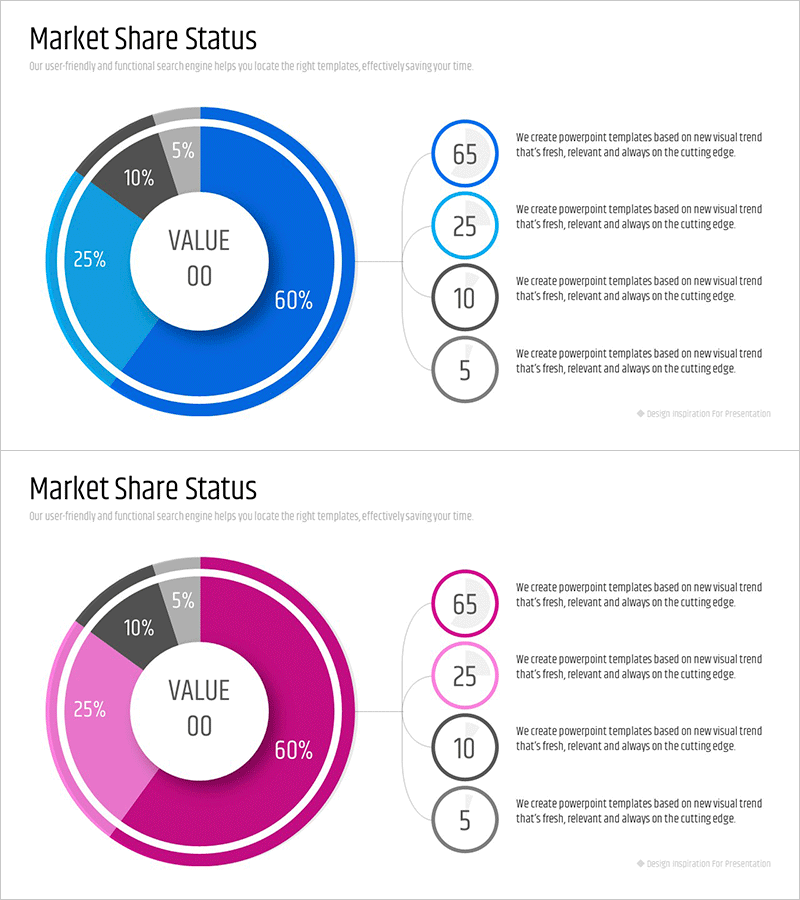
A donut chart PowerPoint slide optimized for market share analysis and ratio visualization. The design features a center VALUE area with a four-segment donut ring structure, enabling intuitive representation of proportional data. Offered in blue and pink color schemes, with circular number badges (65, 25, 10, 5) and accompanying text descriptions on the right side to clearly communicate each item's value and meaning. The 2-slide set provides color variation options, allowing you to match your presentation's visual identity. Ideal for marketing strategies, sales reports, executive presentations, and business analyses where market position, customer composition, or revenue distribution needs clear visual communication.
Usage Points
-
Main Usage
Visualizes market share, customer composition, sales distribution, and budget allocation as proportional segments in a donut chart format. The center VALUE area highlights key metrics while right-aligned circular badges emphasize individual items, supporting hierarchical data comprehension.
-
How to Use
Apply in marketing strategy presentations, sales performance reports, executive briefings, and customer analysis documents to communicate ratio-based insights. Use the blue version for credibility-focused business reports and the pink version for creative, dynamic marketing materials.
-
Recommended For
Marketing professionals, sales managers, executives, data analysts, and consultants presenting market conditions, customer segmentation, channel distribution, or budget allocation. Particularly effective when comparing four or fewer proportional categories.
-
Slide Structure
Slide 1: Blue-toned donut chart (60%, 25%, 10%, 5% segments), center VALUE 00 text, four circular badges (65, 25, 10, 5) with description text on right / Slide 2: Pink-toned identical layout. 16:9 aspect ratio, PPTX format.
Related Products
-

Development Status Donut-Shaped Circle Graph
#Product/Service Introduction #Market and Competitor Analysis #Diagram
-

Analysis of Transportation Usage Status – Pie Chart
#Product/Service Introduction #Market and Competitor Analysis #Graph
-

Graph of Analysis of Transportation Development Status
#Product/Service Introduction #Market and Competitor Analysis #Graph
-

Sales Status Analysis Graph – Simple and Stylish Design
#Product/Service Introduction #Market and Competitor Analysis #Graph
