Stock Market Share Analysis Graph – Insights and Strategies
RJ0300094_7
- Last Update 05/15/2025
- File Size 2.2MB
- # of Slides 2
- File Format PPTX
- Slide Ratio 16:9
- Color
Keywords
- #Content-Based Slides
- #Design-Based Slides
- #Product/Service Introduction
- #Market and Competitor Analysis
- #Graph
- #Development Status
- #Market Share
- #Circles
- #Doughnut Chart
- #16:9
- #donut chart PowerPoint slide
- #donut graph template
- #ratio analysis chart
- #pie chart alternative
- #data visualization PowerPoint
- #percentage breakdown slide
About the Product
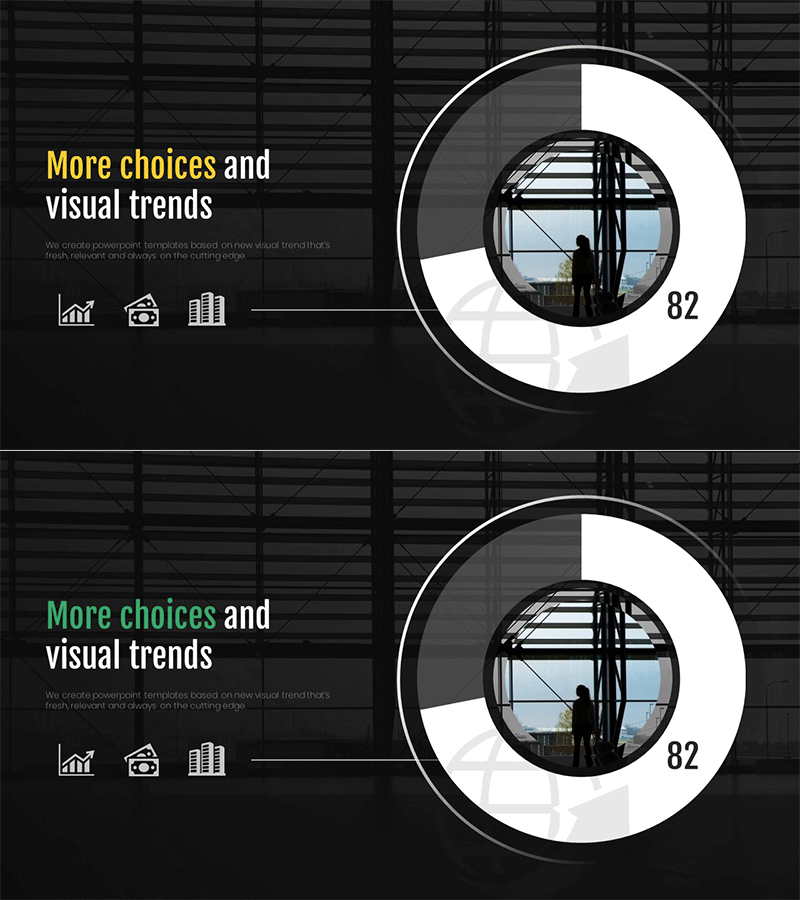
A professional donut chart PowerPoint slide featuring a dark background with white and blue accent tones. The design emphasizes a central figure of 82 with an outer ring displaying proportional data across two tiers, ideal for visualizing market share, revenue composition, and customer distribution. This 2-slide PPTX template in 16:9 widescreen format is fully editable and ready for immediate use in business presentations, reports, and strategic planning decks.
Usage Points
-
Main Usage
The donut chart excels at displaying part-to-whole relationships and proportional data with clarity. The emphasized central figure combined with the outer ring ratio representation enables instant data comprehension, making it ideal for market share analysis, revenue composition, customer segmentation, and budget allocation presentations.
-
How to Use
The minimalist dark background design creates a professional presentation atmosphere. Easily customize the central number and outer ring colors and values to match your data. Insert into business reports, strategy presentations, quarterly performance reviews, and investor decks to enhance data credibility and visual impact.
-
Recommended For
Recommended for finance teams, marketing departments, and executive presentations. Particularly effective for market analysis, competitive comparison, customer composition analysis, and budget status reports. Ideal for investor presentations, executive briefings, and strategic planning meetings.
-
Slide Structure
Two-slide template featuring donut chart layouts with a central emphasis area for key figures, outer ring for proportional data representation, and left-aligned text area for titles and descriptions. The 16:9 widescreen format with dark background and white-blue contrast maximizes data readability and visual hierarchy.
Related Products
-

Analysis of Transportation Usage Status – Pie Chart
#Product/Service Introduction #Market and Competitor Analysis #Graph
-

Doughnut Chart Visualizing Current Status of 3D Printing Technology Development
#Product/Service Introduction #Market and Competitor Analysis #Graph
-

Map Donut Graph for Visualizing Market Share – Symbol of Practicality and Change
#Product/Service Introduction #Market and Competitor Analysis #Graph
-

Analysis graph of market share progress
#Product/Service Introduction #Market and Competitor Analysis #Graph
