Development Status Donut-Shaped Circle Graph
RJ0300042_16
- Last Update 04/29/2025
- File Size 0.4MB
- # of Slides 2
- File Format PPTX
- Slide Ratio 16:9
- Color
Keywords
- #Content-Based Slides
- #Design-Based Slides
- #Product/Service Introduction
- #Market and Competitor Analysis
- #Diagram
- #Graph
- #Development Status
- #Market Share
- #Structure
- #Circles
- #Tree Diagram
- #Doughnut Chart
- #16:9
- #donut chart PowerPoint slide
- #pie chart template
- #3-segment ratio visualization
- #development status slide
- #donut graph PowerPoint download
About the Product
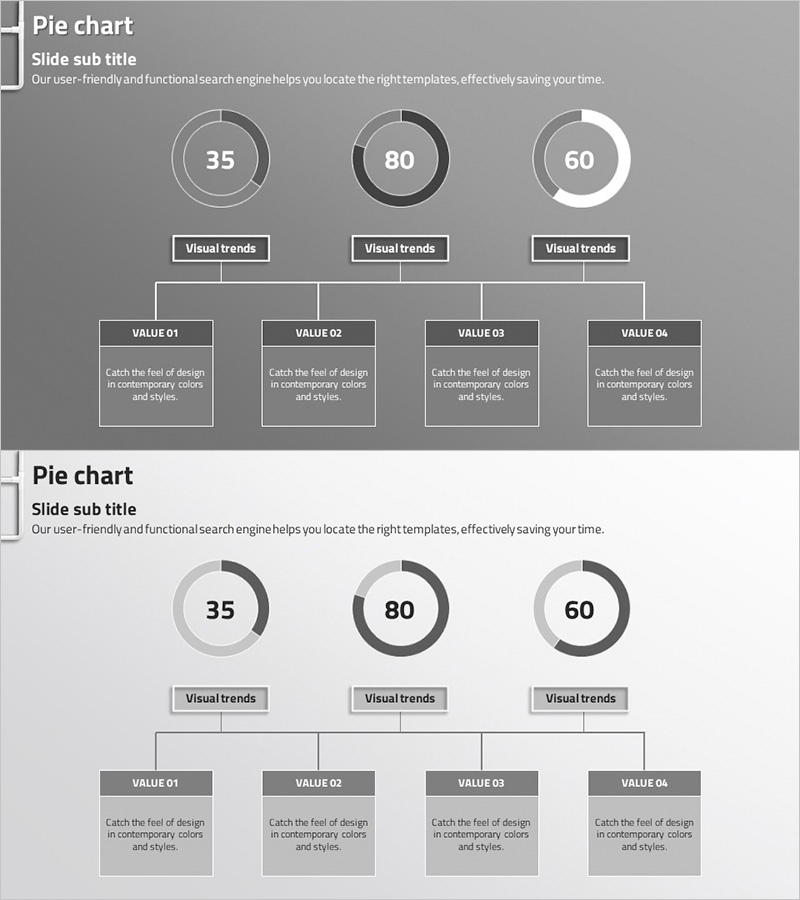
A PowerPoint slide template featuring three donut-shaped pie charts for simultaneously displaying ratio data such as development progress, market share, and project completion rates. Includes two versions: one with a gray background and one with a light background. Each slide contains three donut charts with centered percentage numbers and bottom text box areas for detailed descriptions. The central numeric display and outer progress indicators ensure clear data comprehension. Ready to use in business presentations, reports, business plans, and strategic documents.
Usage Points
-
Main Usage
Optimized for comparing and displaying three or more ratio datasets simultaneously, such as project development progress, market share analysis, and business performance metrics. The centered numbers and outer progress indicators enable precise data communication and audience understanding.
-
How to Use
Replace the donut chart numbers and labels with your actual data values, then add explanatory text or key insights in the bottom text boxes. Use the gray background version for formal reports and the light background version for internal team meetings and presentations.
-
Recommended For
Project managers, business planning teams, marketing professionals, and financial analysts presenting quarterly performance reports, market analysis, and resource allocation status. Ideal for investor presentations, executive briefings, and team meeting materials.
-
Slide Structure
Two slides with three donut-shaped pie charts per slide (each displaying percentage in the center) and four text box areas at the bottom. Gray-tone background with white, black, and light gray donut colors for data hierarchy distinction. Optimized for 16:9 widescreen format.
Related Products
-

Market Share Analysis Graph – Efficient Data Visualization
#Product/Service Introduction #Market and Competitor Analysis #Diagram
-

Mobile App Market Share Analysis Graph
#Product/Service Introduction #Market and Competitor Analysis #Diagram
-

Development Status Analysis Donut Chart – Market Share Visualization
#Product/Service Introduction #Market and Competitor Analysis #Graph
-

Stock Market Share Analysis Graph – Insights and Strategies
#Product/Service Introduction #Market and Competitor Analysis #Graph
