Asset & Liability Calculation Table – Optimized for Financial Management
RM0600004_26
- Last Update 02/24/2025
- File Size 0.2MB
- # of Slides 2
- File Format PPTX
- Slide Ratio 16:9
- Color
Keywords
About the Product
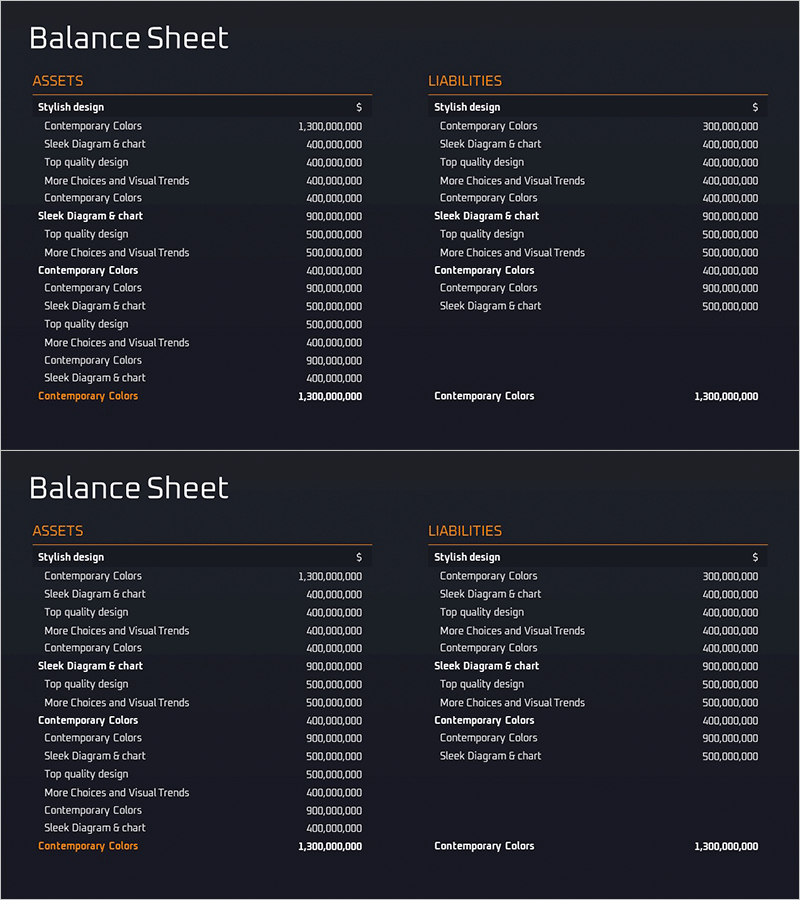
An essential financial management and accounting reporting PowerPoint slide featuring a professional balance sheet layout. This 2-slide set uses a dark gray background with white typography and orange accent colors, clearly separating Assets (left column) and Liabilities (right column) in a two-column structure. Each line item has dedicated data entry fields, maximizing readability for financial figures. Instantly applicable to investor presentations, financial reports, business plans, and quarterly earnings decks.
Usage Points
-
Main Usage
Clearly present financial position by separating assets and liabilities in a structured balance sheet format. This core financial slide builds credibility with investors, board members, and financial institutions, supporting data-driven decision-making.
-
How to Use
Enter actual financial figures in the ASSETS column (left) and LIABILITIES column (right). Add detailed line items under each category and display totals at the bottom. The layout is designed for direct insertion into financial reports, investor decks, and quarterly presentations.
-
Recommended For
CFOs, financial controllers, accountants, and investment managers presenting financial status. Ideal for quarterly and annual financial reports, investor presentations, bank loan applications, and business plan financial sections.
-
Slide Structure
Two-slide set with identical two-column layout (ASSETS / LIABILITIES). Each slide features a section title at top, 8-10 line item entry fields in the center, and total amount display at bottom, enabling hierarchical financial data representation.
Related Products
-

Asset, Capital Structure Analysis Table - An Effective Tool for Financial Planning
#Financial Plans and Performance #Diagram #Balance Sheet
-

Yellow Green Income Statement Table – Efficient Financial Analysis
#Financial Plans and Performance #Diagram #Balance Sheet
-

Emphasizing Key Row in Table – Essential Tool for Financial Management
#Financial Plans and Performance #Diagram #Balance Sheet
-

Balance Sheet Slide – Harmonizing Financial Performance and Design
#Financial Plans and Performance #Diagram #Balance Sheet
