Corporate Financial Evaluation Analysis Balance Sheet – Data Visualization
RM0600003_26
- Last Update 02/23/2025
- File Size 0.3MB
- # of Slides 2
- File Format PPTX
- Slide Ratio 16:9
- Color
Keywords
- #Content-Based Slides
- #Design-Based Slides
- #Financial Plans and Performance
- #Diagram
- #Balance Sheet
- #Income Statement
- #Table
- #16:9
- #balance sheet PowerPoint slide
- #financial data presentation template
- #balance sheet template
- #corporate financial analysis slide
- #how to create a balance sheet in PowerPoint
About the Product
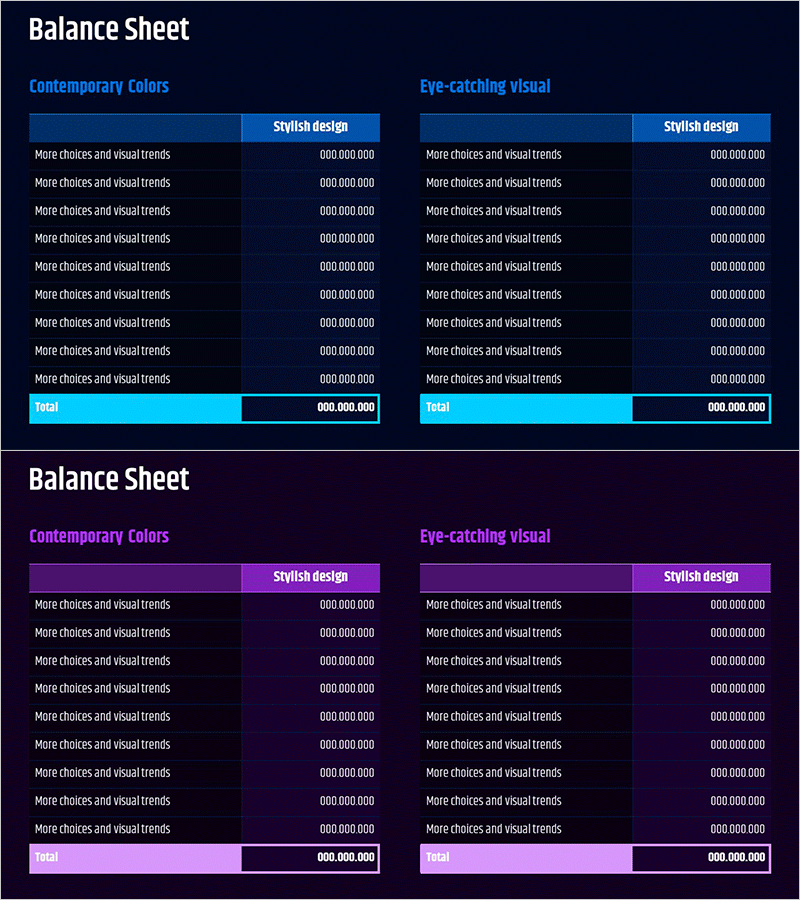
A professional balance sheet PowerPoint slide designed for corporate financial evaluation and analysis presentations. Features two design variations with dark backgrounds and blue or purple accent colors, each displaying a side-by-side two-column comparison layout. The structured table format accommodates financial line items with corresponding numerical data, while the total row is highlighted in cyan or purple to emphasize key figures. Ideal for investor presentations, financial reports, and IR materials to clearly communicate assets, liabilities, and equity positions. Fully editable PPTX format ready for immediate use.
Usage Points
-
Main Usage
Communicate corporate financial position—assets, liabilities, and equity—clearly to investors, financial institutions, and stakeholders. Transforms complex balance sheet figures into a structured, visually organized table format that enables instant comprehension of financial health and performance metrics.
-
How to Use
Integrate into IR decks, financial reports, executive briefings, and investment pitch presentations within the financial section. Input line item descriptions and corresponding figures, and optionally highlight key metrics using the accent color rows. Select either the blue or purple design variant to align with your corporate branding and presentation theme.
-
Recommended For
CFOs, financial controllers, investor relations (IR) specialists, executive reporting teams, financial analysts, auditors, and accounting professionals. Particularly suited for quarterly and annual financial performance presentations, investor meetings, shareholder assemblies, and bank financing discussions.
-
Slide Structure
Two-slide set, each featuring a side-by-side two-column comparison layout. Header displays 'Balance Sheet' title with color variant label. Central section contains nine financial line item rows (assets, liabilities, equity categories) with numerical input fields. Footer includes a highlighted 'Total' row in accent color. Approximately 20 editable text areas (9 item labels + 9 data fields + 2 headers).
Related Products
-

Asset & Liability Calculation Table – Optimized for Financial Management
#Financial Plans and Performance #Diagram #Balance Sheet
-

Modern Simple Balance Sheet – Intuitive and Sleek Financial Slide
#Financial Plans and Performance #Diagram #Balance Sheet
-

Yellow Green Income Statement Table – Efficient Financial Analysis
#Financial Plans and Performance #Diagram #Balance Sheet
-

Visualizing Financial Status with Balance Sheet Table
#Financial Plans and Performance #Diagram #Balance Sheet
