4-Person Household User Analysis Graph – Customer Insight
RM0100016_13
- Last Update 01/30/2025
- File Size 1.6MB
- # of Slides 2
- File Format PPTX
- Slide Ratio 16:9
- Color
Keywords
- #Content-Based Slides
- #Design-Based Slides
- #Market and Competitor Analysis
- #Graph
- #Market Status
- #Customer Analysis
- #Horizontal Bar
- #Horizontal Bar Chart
- #16:9
- #horizontal bar chart PowerPoint
- #bar graph presentation slide
- #data comparison chart
- #customer analysis graph
- #numerical comparison template
About the Product
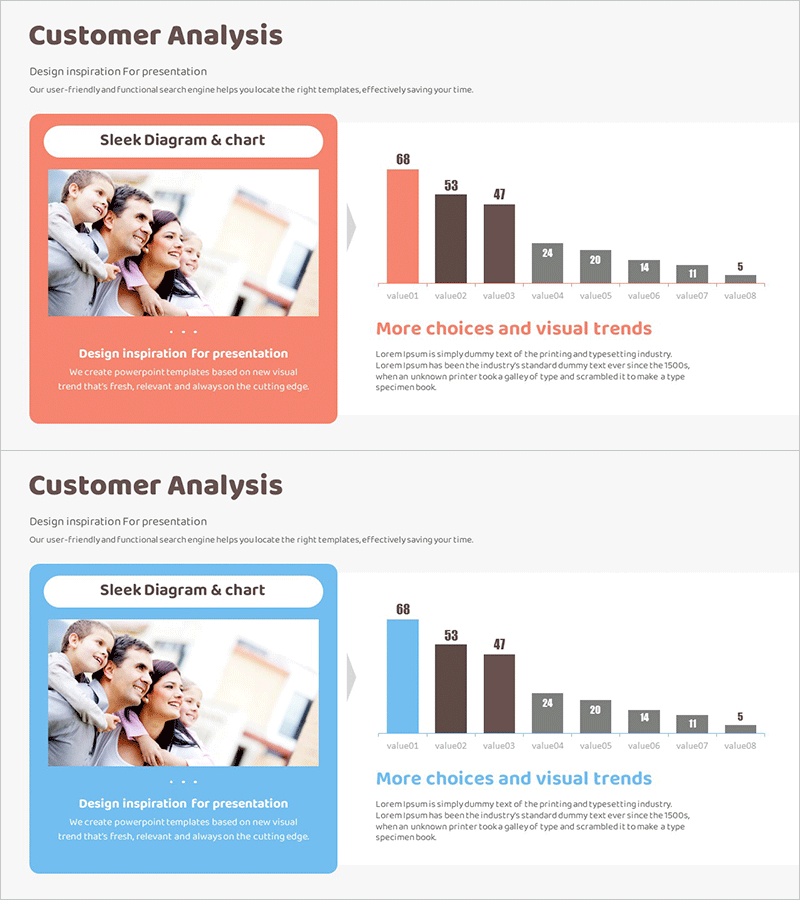
A horizontal bar chart PowerPoint slide designed to visualize customer analysis and user insights. The slide features a coral-colored primary bar with brown and gray secondary bars comparing eight data values, making it ideal for marketing reports, customer analysis presentations, and data-driven decision-making materials. With a 16:9 aspect ratio and 2-slide layout, all text, numbers, and colors are fully editable, allowing you to adapt the slide for various comparative analysis scenarios.
Usage Points
-
Main Usage
Compares eight data points—such as customer segments, user behavior, or market metrics—horizontally to show ranking and magnitude differences at a glance. Suitable for marketing analysis, customer insights, sales data, survey results, and any presentation requiring quantitative comparison.
-
How to Use
Double-click the bar lengths, values, and item labels to edit and input your data. Adjust colors using theme color options or select individual bars to change colors manually. Modify the title and description text boxes to match your presentation context.
-
Recommended For
Marketing professionals, planners, analysts, and sales managers presenting customer analysis, market research, sales performance, and survey findings. Particularly suited for household segment, generational, regional, and age-group comparisons. Works well for executive reports, investor presentations, and internal meetings.
-
Slide Structure
Two-slide layout where the first slide displays eight items using one coral primary bar and two secondary bars in brown and gray. The second slide offers an alternative design with different color combinations, arrangement, and emphasis points to support diverse data representations.
Related Products
-

Analysis of Consumer Usage Status – Market and Customer Trends
#Market and Competitor Analysis #Graph #Market Status
-

Triple Blue Green Donut Chart – Visual Data Analysis
#Market and Competitor Analysis #Graph #Market Status
-

Stylish Design Business Presentation Template
#Market and Competitor Analysis #Graph #Market Status
-

Business Plan Presentation Template Bar Diagram Sample
#Market and Competitor Analysis #Marketing Plan and Strategy #Graph
