Analysis of Consumer Usage Status – Market and Customer Trends
RM0100013_13
- Last Update 01/28/2025
- File Size 0.4MB
- # of Slides 2
- File Format PPTX
- Slide Ratio 16:9
- Color
Keywords
- #Content-Based Slides
- #Design-Based Slides
- #Market and Competitor Analysis
- #Graph
- #Market Status
- #Customer Analysis
- #Horizontal Bar
- #Horizontal Bar Chart
- #16:9
- #horizontal bar chart PowerPoint
- #consumer analysis slide template
- #market trends presentation
- #customer data visualization
- #comparative data chart
About the Product
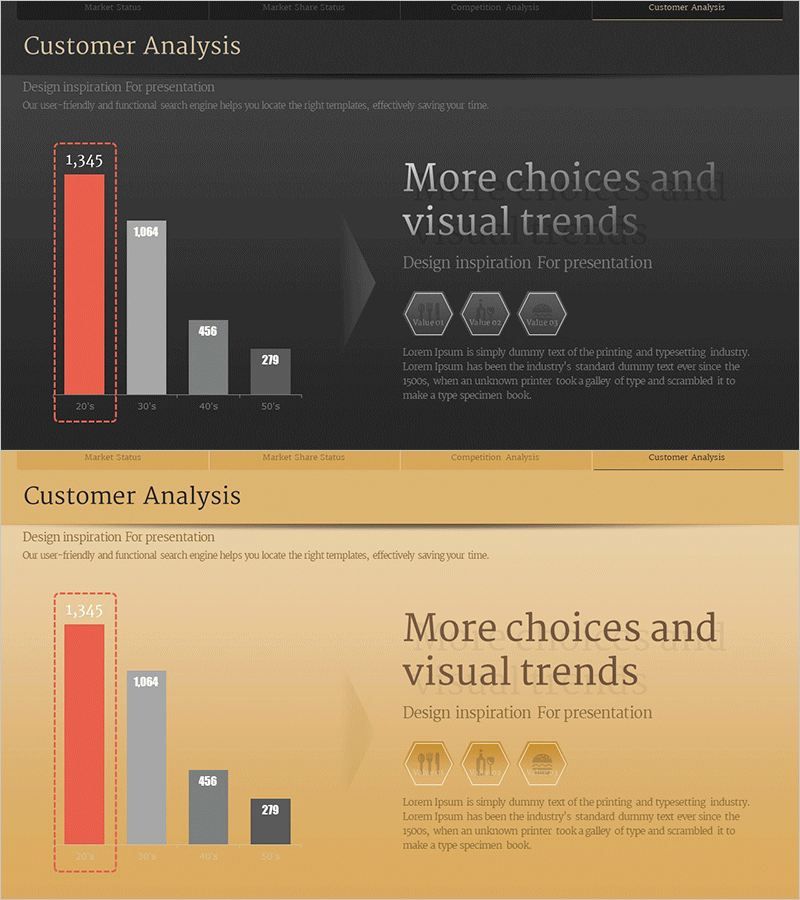
A horizontal bar chart PowerPoint slide designed to visualize consumer usage patterns and market trends. The dark gray background with coral red accent color highlights key metrics (1,345), enabling clear comparison of four data points. This presentation slide effectively communicates customer behavior analysis, market status, and consumer insights. Available in 16:9 widescreen PPTX format, fully editable and ready for marketing reports, strategic presentations, and data-driven business analysis.
Usage Points
-
Main Usage
Visualize consumer analysis data through a 4-item horizontal bar chart that clearly presents market status and customer trends. The horizontal bar format enables intuitive comparison of values across categories, while the coral red accent effectively highlights the primary metric.
-
How to Use
Use in marketing strategy presentations, market analysis reports, customer segmentation studies, and consumer behavior research presentations. Simply replace the numerical values with your actual data to create a professional analysis slide immediately.
-
Recommended For
Marketing professionals, market analysts, executives, consultants, and research teams presenting consumer data insights to stakeholders, clients, and team members. Ideal for B2B proposals, quarterly performance reports, and market research presentations.
-
Slide Structure
Two-column layout with horizontal bar chart on the left (4 items with value labels) and text with hexagon icons on the right. Title at top, descriptive text at bottom, center divider arrow for information hierarchy. Color scheme: dark gray, coral red, and light gray.
Related Products
-

4-Person Household User Analysis Graph – Customer Insight
#Market and Competitor Analysis #Graph #Market Status
-

Donut Chart of the Share of Real Estate Ownership – For Market Analysis
#Market and Competitor Analysis #Graph #Market Status
-

Horizontal Bar Graph for Product Performance Analysis
#Market and Competitor Analysis #Financial Plans and Performance #Graph
-

Plastic Waste Emission PowerPoint Slide – Donut Chart
#Market and Competitor Analysis #Graph #Market Status
