Plastic Waste Emission PowerPoint Slide – Donut Chart
RJ0600114
- Last Update 06/04/2026
- File Size 2.8MB
- # of Slides 2
- File Format PPTX
- Slide Ratio 16:9
- Color
Keywords
- #Design-Based Slides
- #Market and Competitor Analysis
- #Graph
- #Market Status
- #Horizontal Bar
- #Circles
- #Horizontal Bar Chart
- #16:9
- #plastic waste analysis PowerPoint slide
- #environmental data donut chart presentation
- #ESG report PowerPoint slide
- #waste emission analysis slide
- #sustainability presentation PowerPoint
About the Product
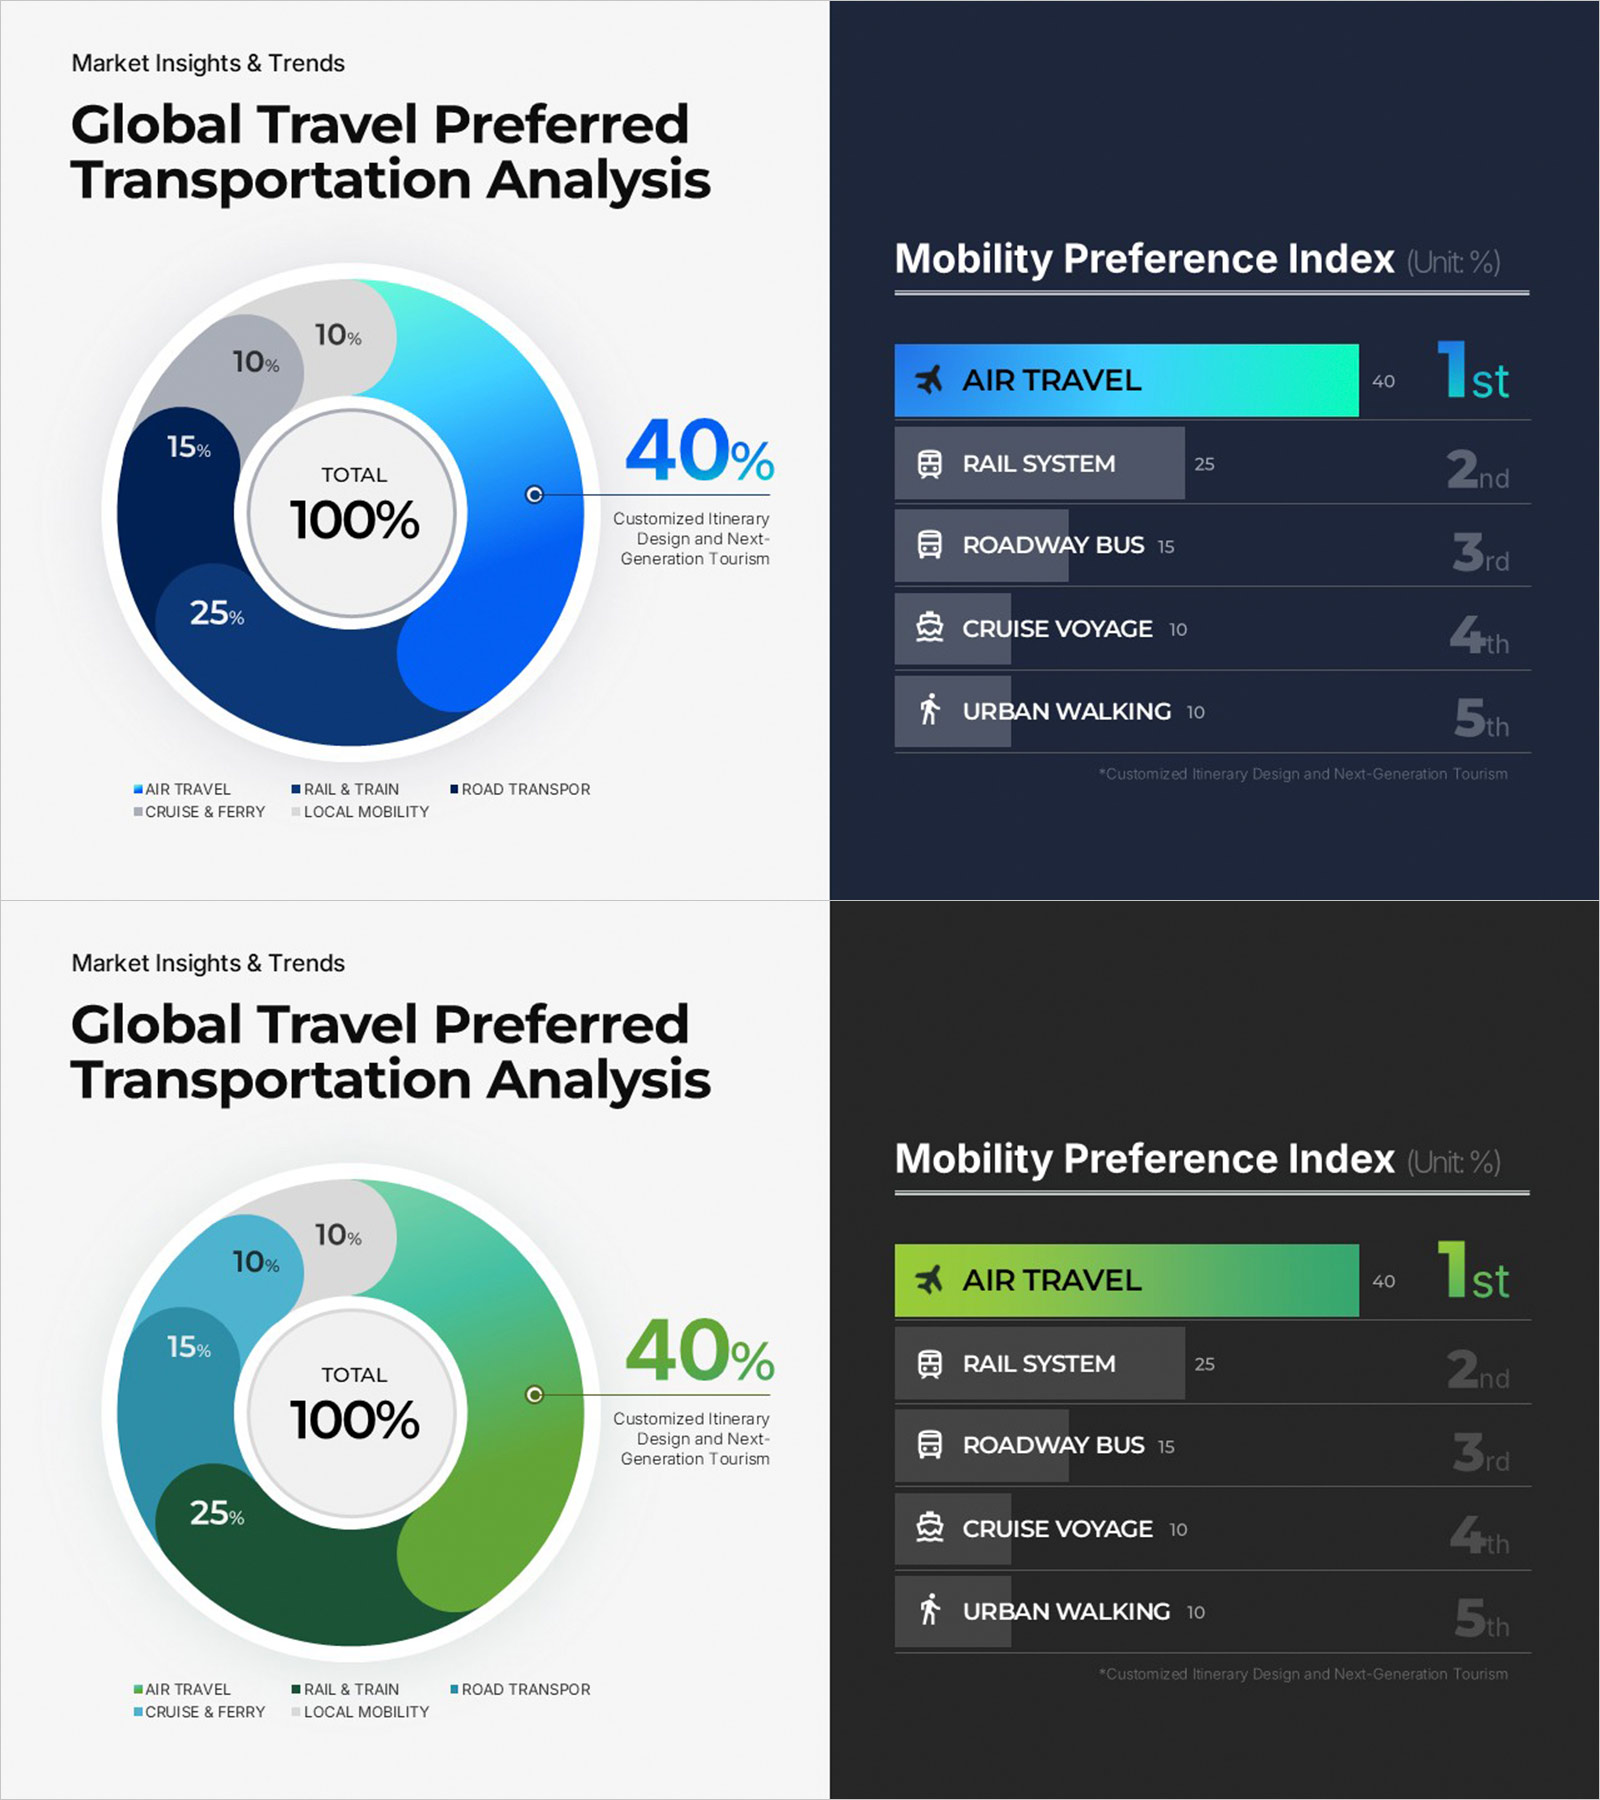
This environmental analysis slide visualizes annual plastic waste emission data with a three-column balanced layout. A center donut chart shows emission ratios at 58% and 42%, while a highlighted metric box on the left presents the total emission figure. Two icon-labeled panels on the right cover landfill & incineration and recycling rate categories with bullet-point explanations. Icons and concise text organize complex environmental statistics in a structured, professional format. Two color variants — dark green and teal-blue — are included to match your reporting style. Fully editable in PPTX format, this presentation slide is ready for immediate use in ESG reports, CSR documents, and sustainability briefings.
Usage Points
-
Main Usage
Presents annual plastic waste emission statistics using a central donut chart and metric panels, designed for ESG reports, CSR documents, and sustainability briefings.
-
How to Use
Enter emission figures in the left metric box, set the donut chart ratios, and fill the two right-side icon panels with your environmental category data and bullet-point details.
-
Recommended For
ESG consultants, corporate CSR and sustainability teams, environmental policy professionals, and report writers who need data-driven environmental presentations.
-
Slide Structure
Single slide with left metric highlight box, center donut chart (58%/42% ratio), and two right-side icon panels. Available in both dark green and teal-blue color variants.
Related Products
-

Market Share Status of Premium Cafe Industry
#Market and Competitor Analysis #Graph #Market Status
-

Meal Concept Pie Chart – Market Share Analysis
#Market and Competitor Analysis #Graph #Market Status
-

Eco-friendly Light Bulb Pie Chart – Market Share Analysis
#Market and Competitor Analysis #Graph #Market Status
-

Visualizing Market Situation with Donut Chart – Collaboration and Challenge
#Market and Competitor Analysis #Graph #Market Status
