Apparel Industry Market Analysis Graph – Visualizing Growth Statistics
RM0100015_10
- Last Update 01/29/2025
- File Size 3.9MB
- # of Slides 2
- File Format PPTX
- Slide Ratio 16:9
- Color
Keywords
- #Content-Based Slides
- #Design-Based Slides
- #Market and Competitor Analysis
- #Diagram
- #Graph
- #Competitor Analysis
- #Market Analysis
- #Table
- #Line
- #Line Chart
- #16:9
- #line chart PowerPoint
- #market analysis slide template
- #dual-series trend graph
- #market status visualization
- #growth statistics PowerPoint slide
About the Product
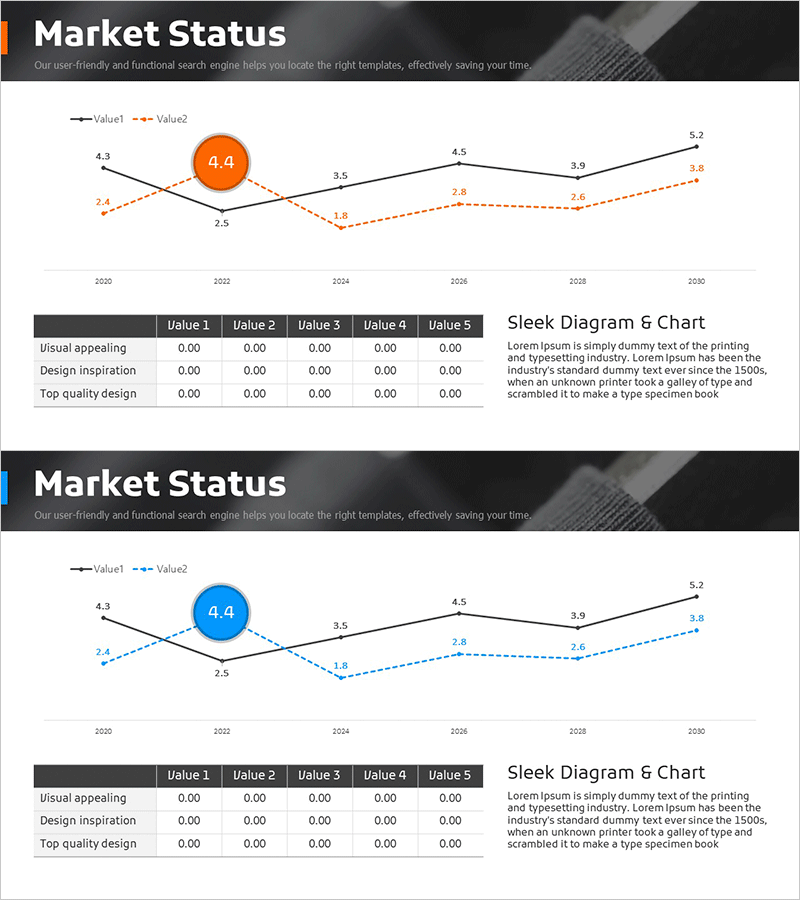
A professional PowerPoint slide featuring a dual-series line chart that visualizes apparel industry market trends from 2020 to 2030. The chart displays Value1 (solid black line) and Value2 (orange dashed line) with clearly labeled data points at each year interval, enabling precise comparison of two market indicators over time. The slide includes a prominent circular highlight element (4.4) and a reference table at the bottom for additional metric evaluation. Designed in 16:9 widescreen format with 2-slide set, this template is ready for immediate use in business presentations, market analysis reports, and strategic planning documents. Data fields are fully editable, allowing seamless customization for different industries and datasets.
Usage Points
-
Main Usage
Designed to visualize market analysis and competitive benchmarking data across time periods. The dual-series line chart effectively compares two key performance indicators simultaneously, with numerical labels at each data point ensuring accurate statistical communication. Applicable to any industry sector for presenting market conditions, growth rates, competitive positioning, and trend forecasting.
-
How to Use
Insert this slide into the market analysis section of business presentations, investment pitch decks, marketing strategy documents, and annual reports. The layout accommodates both the primary trend visualization and supporting metrics table, allowing you to present comprehensive market insights. Customize the data values, axis labels, and table content to match your specific industry and analytical focus.
-
Recommended For
Ideal for apparel, fashion, retail, and consumer goods industry professionals including executives, marketing managers, and business strategists. Also valuable for management consulting firms, market research agencies, investment banks, and academic researchers preparing industry analysis reports, thesis presentations, and competitive intelligence documents.
-
Slide Structure
Two-slide set with consistent layout: header section with 'Market Status' title and descriptive text, central dual-series line chart spanning 2020-2030 with six annual data points, circular emphasis element (4.4) positioned on the right, and a five-column evaluation table at the bottom. First slide features orange accent color, second slide uses blue accent for visual variety. Both slides maintain 16:9 widescreen aspect ratio for modern presentation environments.
Related Products
-

Target Market Analysis Line Graph – Visualizing Market Status
#Market and Competitor Analysis #Diagram #Graph
-

Sales and Profit Analysis Graph – Market Trends and Forecast
#Market and Competitor Analysis #Diagram #Graph
-

Black Navy Broken Line Graph Table – Market and Competitor Analysis
#Market and Competitor Analysis #Diagram #Graph
-

Graph Chart for Analysis Comparison – Market and Competitor Analysis
#Market and Competitor Analysis #Diagram #Graph
