Target Market Analysis Line Graph – Visualizing Market Status
RM0100014_10
- Last Update 01/29/2025
- File Size 0.3MB
- # of Slides 2
- File Format PPTX
- Slide Ratio 16:9
- Color
Keywords
About the Product
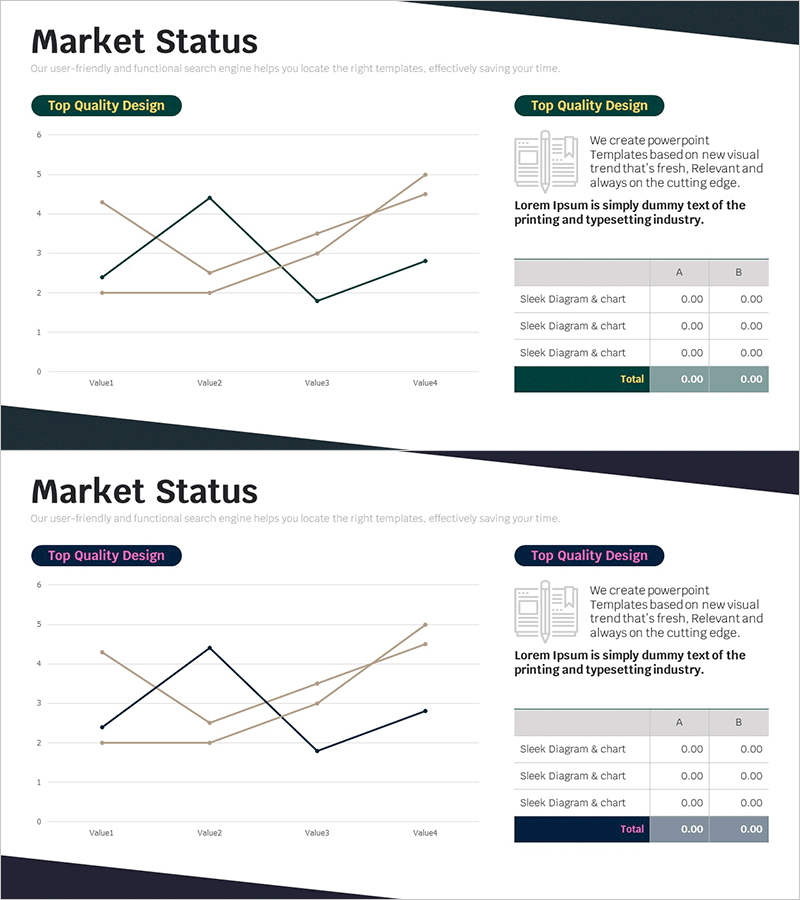
A multi-series line graph PowerPoint slide designed for market status and competitive analysis presentations. This template visualizes four independent data series across a timeline using four distinct colors: dark green, light gray, beige, and navy. The horizontal axis displays Value1 through Value4 items, while the vertical axis shows a 0–6 numerical range, enabling simultaneous comparison of values and trend identification. The right panel includes a product description area and a data table with input fields, making this slide deck immediately applicable to business reports and presentations.
Usage Points
-
Main Usage
Compares multiple indicators' changes over time simultaneously, making it ideal for market status monitoring, competitor performance tracking, quarterly revenue trends, and customer satisfaction evolution. Supports presentations requiring multi-dataset analysis.
-
How to Use
Input actual data into the left-side line graph to visualize trends, then populate the right-side data table with numerical values. Maintain color consistency with the legend for each series, and customize axis labels and titles to match your presentation context.
-
Recommended For
Executives, marketing teams, sales professionals, analysts, and consultants presenting quarterly reports, strategy meetings, investor briefings, and market analysis. Particularly suited for competitive landscape analysis, performance reporting, and market trend explanations in business presentations.
-
Slide Structure
Two-slide layout with each slide featuring a 4-series line graph (Value1–Value4, 0–6 range) on the left and a right panel containing a 'Top Quality Design' badge, product description text, and a 3-row data table (columns A and B, with Total row). Formatted in 16:9 widescreen aspect ratio.
Related Products
-

Line Chart & Table – Market and Competitor Analysis
#Market and Competitor Analysis #Diagram #Graph
-

Sales and Profit Analysis Graph – Market Trends and Forecast
#Market and Competitor Analysis #Diagram #Graph
-

Competitive Market Analysis Graph - Insights for Understanding the Market
#Market and Competitor Analysis #Diagram #Graph
-

Business Competitor Analysis Comparison Graph – Market Status Insight
#Market and Competitor Analysis #Diagram #Graph
