Market Analysis Graph Template – Effective Tool for Competitor Analysis
RM0100003_10
- Last Update 01/25/2025
- File Size 3.1MB
- # of Slides 2
- File Format PPTX
- Slide Ratio 16:9
- Color
Keywords
- #Content-Based Slides
- #Design-Based Slides
- #Market and Competitor Analysis
- #Diagram
- #Graph
- #Competitor Analysis
- #Market Analysis
- #Table
- #Line
- #Line Chart
- #16:9
- #line chart PowerPoint slide
- #trend analysis presentation template
- #market analysis chart
- #competitive analysis graph
- #data visualization PowerPoint
About the Product
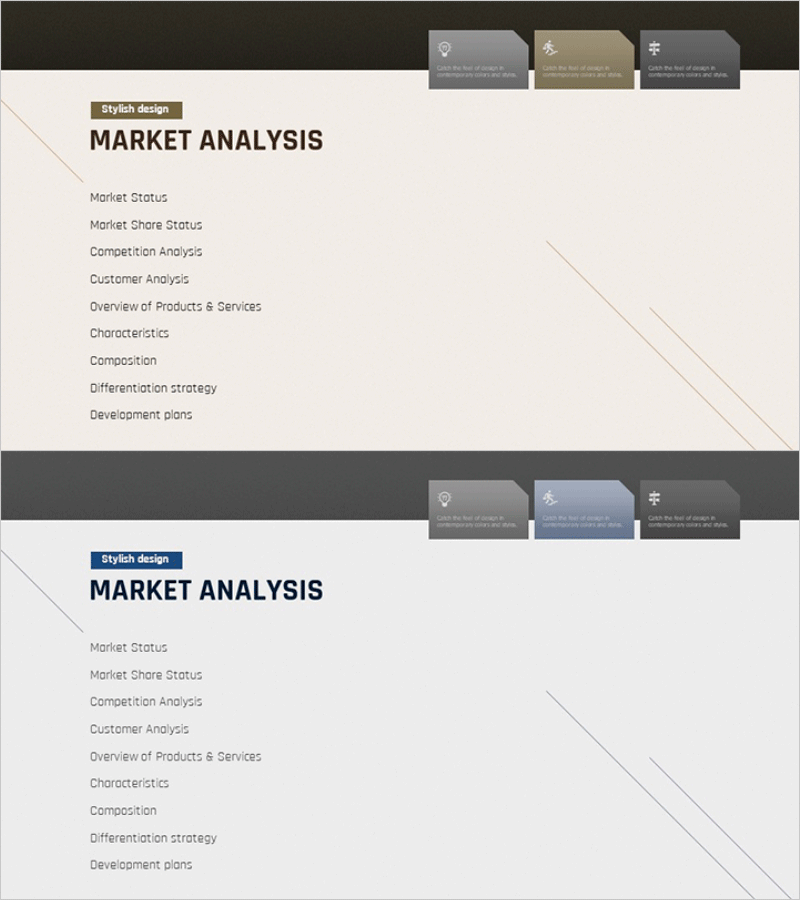
A dual-series line chart PowerPoint slide designed for market analysis and competitive benchmarking. This presentation template visualizes two data streams from 2021 to 2030, enabling clear comparison of trends over time. The design features a neutral beige and brown background with black lines and circular data point markers for emphasis. Navigation tabs at the top organize key sections such as Market Status, Competition Analysis, and Customer Analysis, while a legend table and text area at the bottom provide space for numerical values and interpretations. Ready to use in business reports, marketing plans, and investor presentations.
Usage Points
-
Main Usage
Compares two data series over time to illustrate market conditions, competitor performance, or sales trends. Ideal for business reports, marketing strategy presentations, and investor pitch decks where numerical changes must be communicated clearly.
-
How to Use
Use the top navigation tabs to switch between analysis sections during your presentation. Reference the numerical labels above the line chart to highlight key inflection points, and populate the legend table and text area below with your interpretation. Colors and line weights are fully editable.
-
Recommended For
Executives, marketing teams, strategic planners, and finance professionals presenting market analysis findings. Suitable for quarterly performance reviews, competitive benchmarking, customer satisfaction trends, and other comparative analysis scenarios.
-
Slide Structure
Dual-series line chart (10-year data from 2021-2030, 5-6 data points per series), 3 navigation tabs at top, legend table at bottom (Value 01, Value 02, Number, Test title columns), diagonal decorative element on left side.
Related Products
-

Business Competitor Analysis Comparison Graph – Market Status Insight
#Market and Competitor Analysis #Diagram #Graph
-

Competitor Market Analysis Table – Strategic Insights
#Market and Competitor Analysis #Diagram #Graph
-

Target Market Trend Analysis Graph by Year – Market and Competitor Analysis
#Market and Competitor Analysis #Diagram #Graph
-

Sales and Profit Analysis Graph – Market Trends and Forecast
#Market and Competitor Analysis #Diagram #Graph
