Comparison Table Slide – Market and Competitor Analysis
RJ0900005_23
- Last Update 08/17/2025
- File Size 0.8MB
- # of Slides 2
- File Format PPTX
- Slide Ratio 16:9
- Color
Keywords
- #Content-Based Slides
- #Design-Based Slides
- #Market and Competitor Analysis
- #Financial Plans and Performance
- #Diagram
- #Competitor Analysis
- #Sales and Revenue
- #Table
- #16:9
- #comparison table PowerPoint slide
- #market analysis data table
- #competitor analysis presentation
- #side-by-side comparison slide
- #financial data table PPT
About the Product
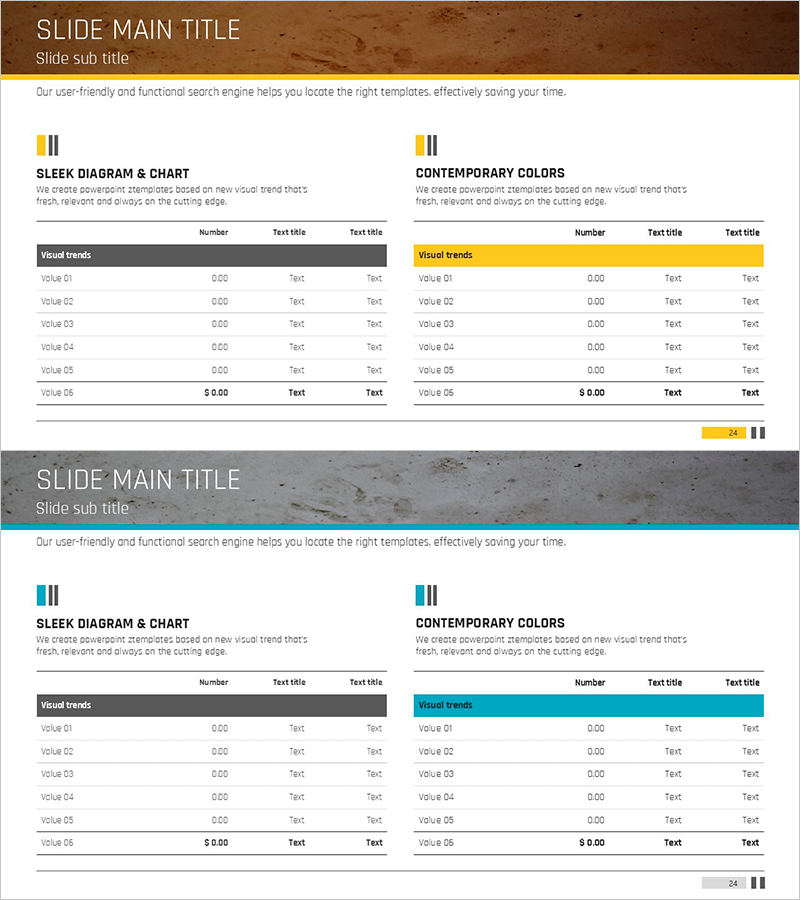
A 2-slide PowerPoint presentation optimized for market analysis and competitive comparison. The first slide features a brown background with a 6-row, 3-column table for organizing numerical data, while the second slide applies a teal header to the same table structure, emphasizing visual contrast. Each table begins with a 'Visual trends' row and accommodates six data items with corresponding values and text entries, concluding with a total row in standard financial and analytical layout. Created in 16:9 widescreen format suitable for modern presentation environments and delivered as fully editable PPTX files.
Usage Points
-
Main Usage
Presents market conditions and competitive information through quantitative data comparison. Six data items are arranged side-by-side to clearly demonstrate decision-making rationale, with dual color themes maximizing contrast effect for analytical clarity.
-
How to Use
Enter six data items starting from the 'Visual trends' row in each table, then input totals in the summary row. Use the brown theme for traditional analysis and teal theme for contemporary analysis, or apply both slides to compare changes over time.
-
Recommended For
Ideal for business plans, investor pitch decks, and marketing strategy presentations when comparing market size, competitive landscape, and financial metrics. Effectively emphasizes data credibility during executive, investor, and partner presentations.
-
Slide Structure
Two-slide layout. Each slide contains a title section (SLEEK DIAGRAM & CHART / CONTEMPORARY COLORS), descriptive text, and a 6-row 3-column table (1 header row + 5 data rows). Table headers are color-coded, and each cell accepts numerical and text input for flexible customization.
Related Products
-

Red Orange Curved Line Trend Analysis – Market Insights
#Market and Competitor Analysis #Financial Plans and Performance #Diagram
-

Analysis of Brand Logos by Competitors – Market Insights and Visual Data
#Market and Competitor Analysis #Financial Plans and Performance #Diagram
-

Triangle Pattern Column Chart Presentation Template
#Market and Competitor Analysis #Financial Plans and Performance #Diagram
-

Circular Gradient Wide Template Table – Market Analysis and Financial Performance
#Market and Competitor Analysis #Financial Plans and Performance #Diagram
