Artificial Intelligence Development Market Positioning Map – Effective Visual Data Comparison
RJ0400072_15
- Last Update 06/07/2025
- File Size 0.2MB
- # of Slides 2
- File Format PPTX
- Slide Ratio 16:9
- Color
Keywords
- #Content-Based Slides
- #Design-Based Slides
- #Market and Competitor Analysis
- #Marketing Plan and Strategy
- #Diagram
- #Graph
- #Other
- #Market Analysis
- #Positioning
- #Table
- #16:9
- #bubble chart PowerPoint slide
- #dual-axis comparison slide
- #market positioning PPT
- #data visualization PowerPoint
- #how to create bubble chart in PowerPoint
About the Product
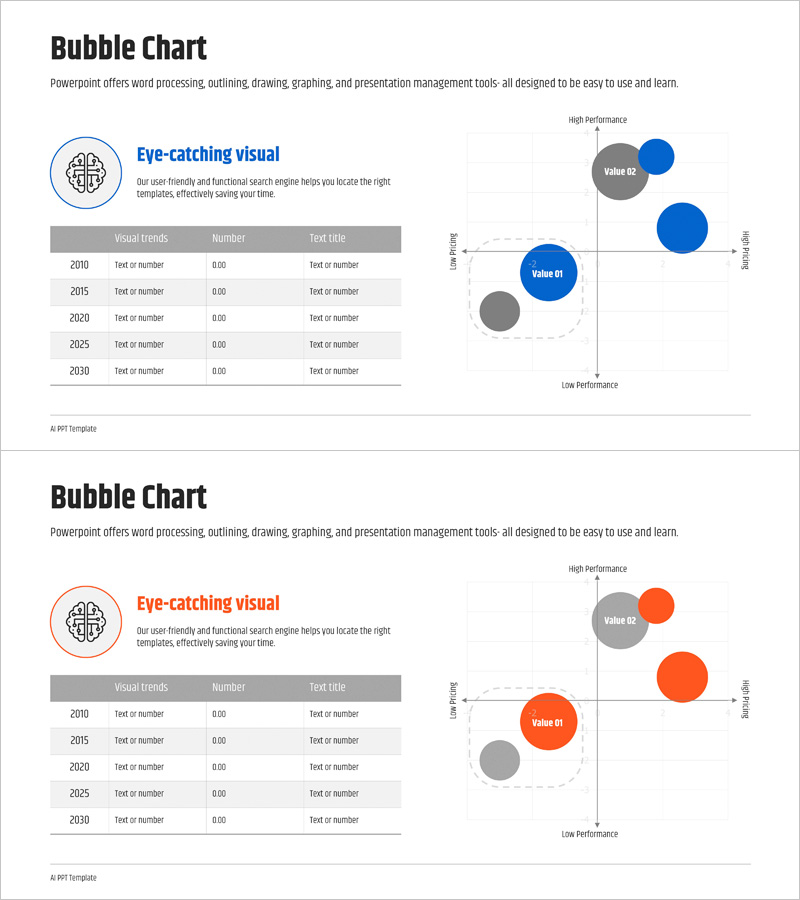
A PowerPoint slide that visualizes three variables simultaneously using bubble size on a dual-axis coordinate system. The left side displays year-by-year data in a structured table, while the right side features a bubble chart comparing performance (Y-axis) and scale (X-axis). Two color versions—blue and orange—are provided, with each bubble's size and position intuitively representing market positioning. This presentation slide effectively communicates multi-variable data such as competitive analysis, product positioning, and ROI comparison in business presentations.
Usage Points
-
Main Usage
Simultaneously express three or more data variables (X-axis, Y-axis, bubble size) on a dual-axis coordinate system to enable at-a-glance understanding of complex market positioning, competitive comparison, and ROI analysis.
-
How to Use
Input year-by-year or product-specific numerical data in the left table, then adjust bubble positions and sizes on the right chart to compare performance, scale, and market share. Select between blue or orange color schemes to match your corporate brand identity.
-
Recommended For
Ideal for market analysis sections requiring competitive positioning, product performance comparison, and ROI analysis. Recommended for executives, analysts, marketers, and investors presenting IR materials, business plans, marketing strategies, and strategic reports.
-
Slide Structure
Two-slide layout: Slide 1 features a left-side data table (3 columns: year, number, text title; 5 rows) plus right-side bubble chart (Y-axis: high/low performance, X-axis: low/high scale, 3-4 bubbles positioned). Slide 2 provides identical layout in orange color variant. 16:9 widescreen format optimized for modern presentation environments.
Related Products
-

Positioning Analysis Chart – Market Competitiveness Strategy
#Market and Competitor Analysis #Marketing Plan and Strategy #Diagram
-

Positioning Market Analysis Chart – Understanding Markets and Strategies
#Market and Competitor Analysis #Marketing Plan and Strategy #Diagram
-

Strategic Positioning Map – Market Analysis and Marketing Strategy
#Market and Competitor Analysis #Marketing Plan and Strategy #Diagram
-

Market Distribution Analysis Positioning Map – Strengthening Competitiveness
#Market and Competitor Analysis #Marketing Plan and Strategy #Diagram
