Consumer Usage Analysis Graph – Essential Presentation for Market Analysis
RM0100012_13
- Last Update 01/28/2025
- File Size 1.5MB
- # of Slides 2
- File Format PPTX
- Slide Ratio 16:9
- Color
Keywords
- #Content-Based Slides
- #Design-Based Slides
- #Market and Competitor Analysis
- #Diagram
- #Graph
- #Market Analysis
- #Horizontal Bar
- #Horizontal Bar Chart
- #16:9
- #horizontal bar chart PowerPoint
- #consumer analysis slide template
- #market analysis graph
- #data visualization PPT
- #how to create bar chart in PowerPoint
About the Product
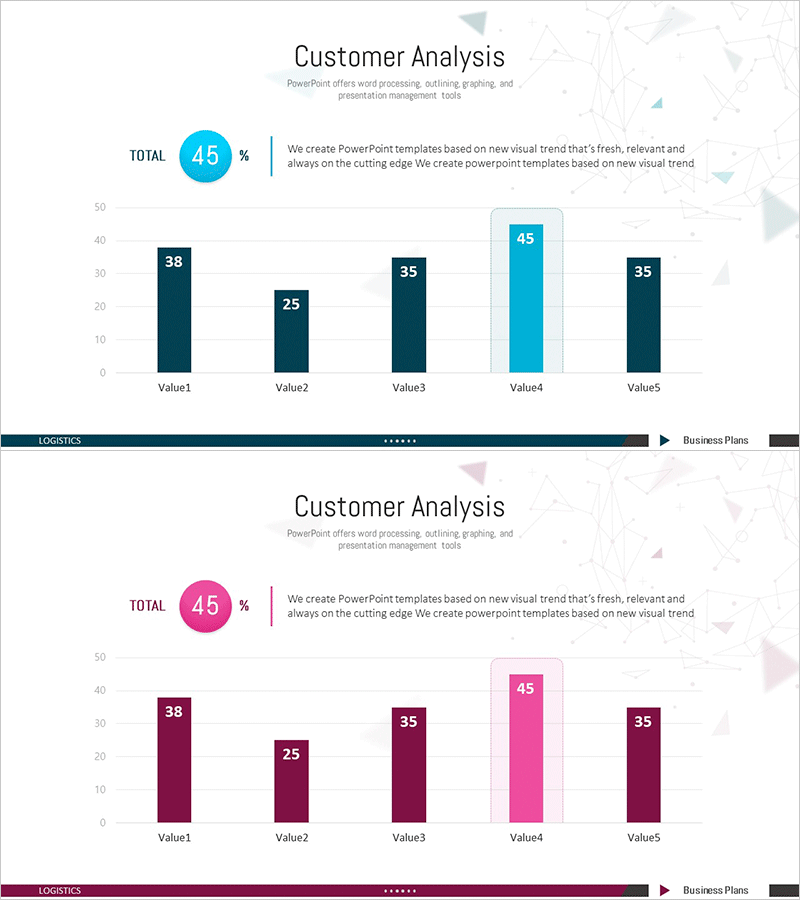
A horizontal bar chart PowerPoint slide designed for consumer usage analysis presentations. This template visualizes comparative data across five items with precise numerical values, complemented by a pie chart showing overall percentage distribution. The dark navy and cyan color scheme reinforces business credibility, while the 16:9 widescreen format with 2 slides enables immediate deployment in market analysis reports and data visualization sections.
Usage Points
-
Main Usage
Clearly visualize comparative metrics such as usage rates, preferences, and market share across five categories in market research and consumer analysis presentations. The integrated pie chart simultaneously displays part-to-whole relationships for comprehensive data storytelling.
-
How to Use
Insert into the data section of marketing plans, business reports, or market analysis documents to explain consumer behavior patterns. Edit bar lengths, numerical values, and labels with your own data, then modify titles and legends for immediate presentation use.
-
Recommended For
Ideal for marketing managers, market analysts, sales planning teams, and executive presentations. Effectively communicates consumer survey results, competitive benchmarking, product preference studies, and channel-specific usage metrics.
-
Slide Structure
Slide 1: Title area + 5-item horizontal bar chart (Value1–Value5 ranging 25–45) with data labels. Slide 2: Pie chart with 45% highlighted + descriptive text area. Dark navy background with cyan and magenta accent colors throughout.
Related Products
-

Blue Green Horizontal Bar Graph – Optimized for Market and Competitive Analysis
#Market and Competitor Analysis #Diagram #Graph
-

Service Market Trends and Analysis Slide (Red and Blue)
#Market and Competitor Analysis #Diagram #Graph
-

Data-driven Trend Analysis PowerPoint Template - Market Insights
#Market and Competitor Analysis #Diagram #Graph
-

Key Performance Comparison Analysis Bar Graph
#Company Introduction #Market and Competitor Analysis #Diagram
